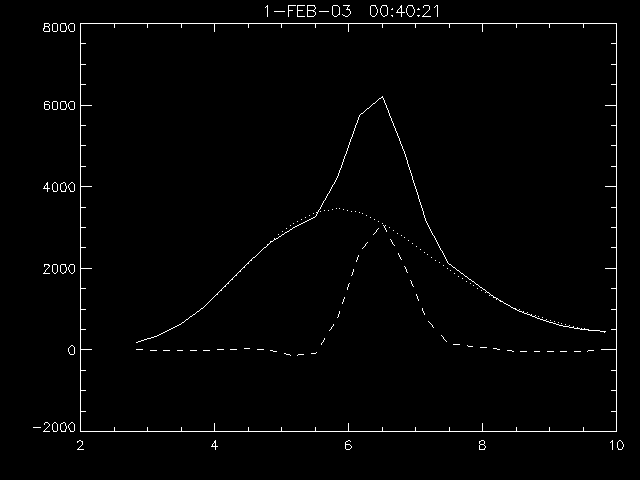

To do the spectral characterization I have taken the RHESSI front-segment counts at 1/3-keV binning in 2-sec integrations, as described in this code (these integrations omit G2 and G8; should have omitted others, see below). The data reduction is then in this code, which starts by breaking the low energies up into three bands:
The line flux in the Fe band is determined by making a 3rd-degree polynomial fit using the F3 and F8 ranges and subtracting that from the total count in the Fe band. We thus have two count-rate intervals that can be used to determine a continuum temperature and emission measure, plus an Fe flux. The residual spectrum (total minus continuum fit) shows the strong Fe feature, which we then fit with a Gaussian.

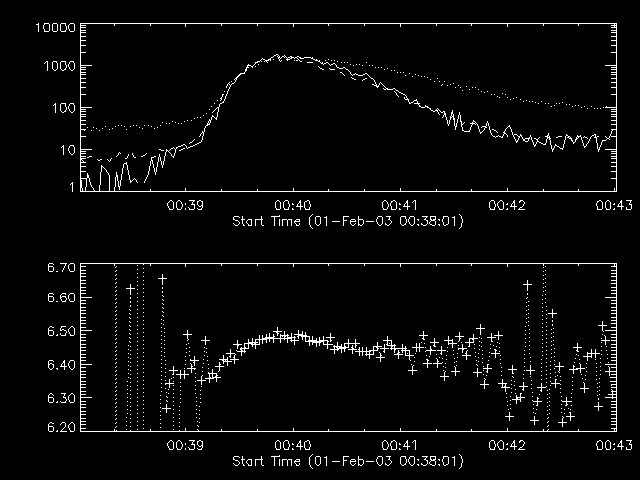
The expectation is that the Fe feature will vary in intensity and location in a physically interesting manner. For example, the centroid energy should would be about (6.4, 6.7, 6.9) keV as the excitation of iron ranges over (cold, He-like, H-like), and the presence of non-thermal excitation would be reflected by a discrepancy between the line location and the F8/F3 temperature. Of course, this simplifies the situation a great deal, but it is a beginning.
The plots below show the variation of broad-band fluxes (F3, feature, F8) and the feature central energy.

How does the Fe feature look in the individual front segments? These plots show fits for each of G1,..., G9, and the Gaussian parameters resulting for the fits to the line feature were as follows:
| Detector (1-9) | Peak | Energy | Sigma | Comment |
| G1 | 7113 | 6.48 | 0.37 | |
| G3 | 6537 | 6.47 | 0.34 | Good resolution, low amplitude! |
| G4 | 10565 | 6.48 | 0.34 | Good resolution, high amplitude |
| G5 | 6241 | 6.45 | 0.56 | Not so good |
| G6 | 8308 | 6.48 | 0.41 | |
| G7 | 882 | 6.60 | 0.98 | Known to be bad |
| G8 | 6806 | 6.49 | 0.43 | |
| G9 | 8575 | 6.48 | 0.42 |
How to explain the G3 result of poor amplitude, but good resolution? The main contributor to the Gaussian amplitude would just be the spreading via detector noise. Note that we are looking at a flare and there will be an error due to modulation, so this another possible place to look. However it may not be likely, because this is an extremely fast event and therefore likely to be compact in scale.
Note: Richard Schwartz has explained the discrepancy noted above by calculating the coarse modulation. As shown here this is severe for G3.
H. Hudson, 19-Mar-03