RHESSI Data Flow
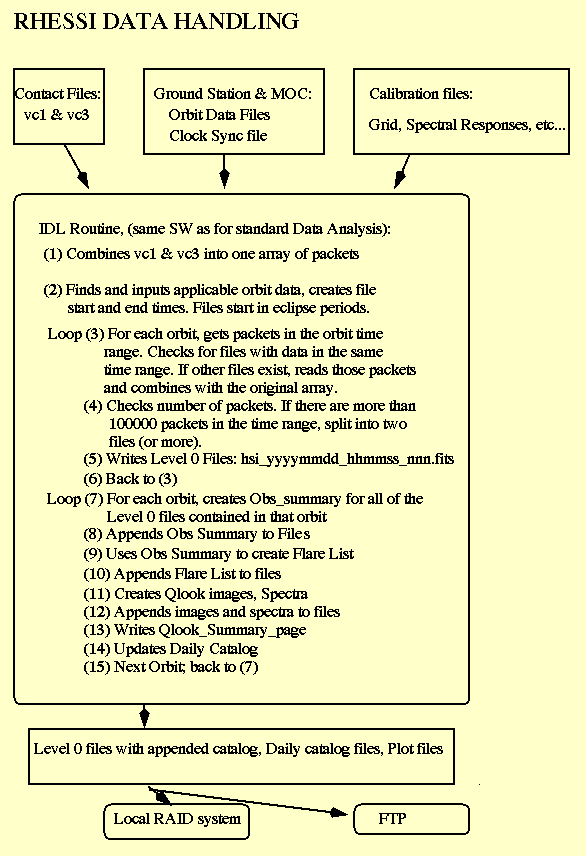
This diagram shows the flow of data through the RHESSI SOC (Science Ops Center).

Data Statistics
As of 30-May-2002 we have dumped approximately 220 Gbytes of data, a rate of 1.9 Gbytes per day. (This is roughly twice the data volume that was expected before launch).
It typically takes 20 to 24 hours after data has been accumulated for it to reach the archive.
RHESSI has observed approximately 600 flares (this number is subject to change as the automated flare recognition software still may need some tweaking). Most are small. Only 2 X-class flares have been observed, and no gamma-ray flares. RHESSI is very sensitive when its attenuators are out, and can observe flares which are barely noticeable in the long wavelength GOES channel.
RHESSI Quicklook Data Products
NOTE: The production of quicklook data products has been automated only since 15-apr-2002. Only selected files with flare data dated before 15-April-2002 have catalog data appended. Also the catalog data is not yet complete, pending the resolution of some issues regarding the RHESSI aspect solution. In particular, the Quicklook aspect solution, the Quicklook images, and spectra are not yet available.
The full data catalog, as described here, will be automated in the next 2 weeks. Old non-appended data will be reprocessed at the same time, and the quicklook data for the whole mission will be online later this summer.
The observing Summary is obtained directly from the telemetry packets. The photons are time-binned and the count rate is compressed to bytes (0.03 accuracy up to 1.0e6 counts/sec). Modulation variance is calculated for the 2 coarsest collimators by calculating the standard deviation of counts for the given interval and dividing by the square root of the total counts in that interval. The spacecraft position and data from the particle detector are also included. The Aspect solution, pointing, roll angle and roll preiod are given also. The nominal interval time for the count rates is the spin period of the spacecraft, 4 seconds ephemeris info is given every 20 seconds, aspect info is given every second.
Quicklook images and spectra are obtained for the peak 1 minute interval of each solar flare. The images are 64X64 with 5 arcsec pixels, there will be one image for each energy band in the observing summary countrates, if there are enough counts in the energy band. The quicklook spectra are "semi-calibrated", i.e., they are the count spectra divided by the diagonal elements of the detector response matrix.
The RHESSI Quicklook Data Products are:
hsi_qlook_summary_page -- Information for an orbit, in string format
Hsi_obs_summ_rate -- contains spin-averaged count rates
Hsi_mod_variance -- The variance in the count rate in collimators 8 and 9.
hsi_ephemeris -- Spacecraft position, in ECI coordinates
hsi_obs_summ_flags -- Various data flags, includes SAA_FLAG, ECLIPSE_FLAG, ATTENUATOR_STATE, etc...
hsi_qlook_pointing -- Spacecraft pointing, and quality
hsi_qlook_roll_period -- Roll (spin) period
hsi_qlook_roll_angle -- Roll angle
hsi_flare_list -- Flare list, includes start, peak, end times, peak count rate and total counts, flare position, etc...
hsi_qlook_image -- Quicklook images
hsi_qlook_spectra -- Quicklook spectra
hsi_qlook_monitor_rates -- Monitor rates for detectors
hsi_qlook_rate_per_det -- Count rates, all energies, for each detector
hsi_qlook_packet_rate -- the rate (packets/minute) for each kind of telemetry packets
Sample Data
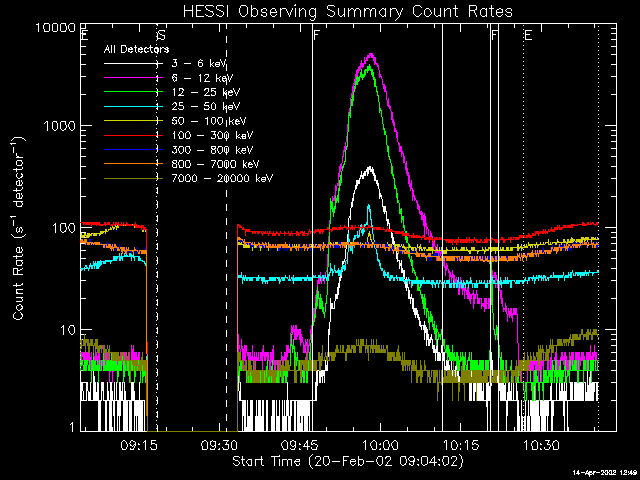
First a count rate plot for a flare which occurred on 20-feb-2002 at approximately 1000 UT:
The Flare times are shown by solid vertical lines. Flare times are obtained by comparing the observing summary count rate in the 12 to 25 keV energy range (green line in the plot) to a threshold. The threshold level is presently set to be 3*sigma above the local background level; the background level is determined using a 1 minute running average of the count rate. This is a very sensitive measurement since the 12 to 25 keV range has a low background level. (note the 2nd flare in the plot). To confirm that a source is solar, the modulation variance is checked; if there is significant modulation (count rate variance > 2*N), then the source is solar. As a backup in case of a source near the spin axis, with no modulation. The ratio of counts in the front detectors, relative to the total rate (front+rear) is also checked, if this ratio is > 90%, then the source is called a solar flare.
Flare Position
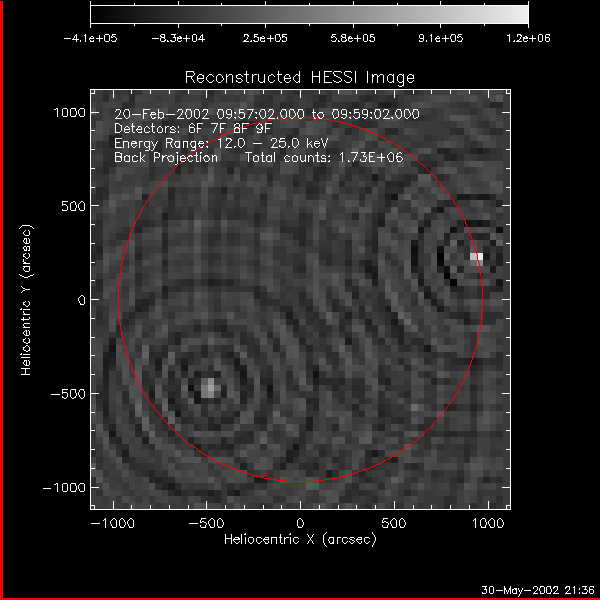
Once a source is confirmed to be solar, then its position is determined by comparing full-sun images (16 arcsec resolution) obtained for each of detectors 5, 6, 7, 8, and 9. The flare position is the maximum for the majority of the images. This image is a full-sun image, using detectors 6, 7, and 8. The flare position is the bright point on the upper right, near the solar limb.

Quicklook Image
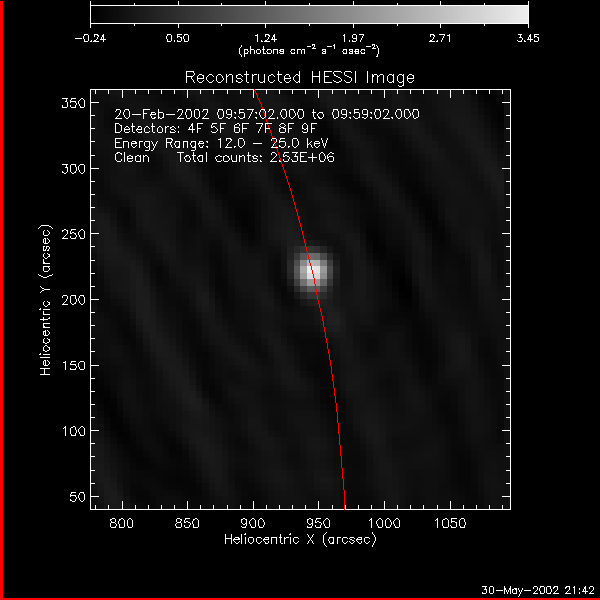
Once the flare position is determined, then Quicklook images are obtained, 64 by 64 pixels with 5 arcsec resolution. The image here is in the 12 to 25 keV energy band, the same as used to find the flare times and position.

The Qlook Summary Page
This is a summary of various data obtained for the orbit that contains the flare time period, A summary of the summary...
FILENAME:
hsi_20020220_090400_006.fits
hsi_20020220_095720_006.fits
hsi_20020220_103540_006.fits
START TIME:
2002-02-20T09:04:00.000Z
END TIME:
2002-02-20T10:40:40.000Z
START ORBIT:
 217
END ORBIT:
 218
N_PACKETS: 207207.
App ids present: 1 10 100 102 154 230 240 250 251 252 260 272 273 274
TIMES IN SUNLIGHT:
2002-02-20T09:18:19.000Z -- 2002-02-20T10:26:41.000Z
TIMES IN SAA:
2002-02-20T09:18:24.000Z -- 2002-02-20T09:31:16.000Z
DATA GAPS:
2002-02-20T09:16:28.000Z -- 2002-02-20T09:33:12.000Z
FLARE INTERVALS:
2002-02-20T09:47:16.000Z -- 2002-02-20T10:11:40.000Z
2002-02-20T10:20:28.000Z -- 2002-02-20T10:22:00.000Z
SEGMENTS NOT INCLUDED: 2f 7f 8f 2r 7r 8r
 SEGMENT:       1f      2f      3f      4f      5f      6f      7f      8f      9f      1r      2r      3r      4r      5r      6r      7r      8r      9r
 AV RATE:       665      608      521      608      903      752      546      750      724      289      273      293      319      253      312      268      313      317
MAX RATE:      9712     7920     7152     8688    11248    10224     7152    10224    10224      352      336      368      400      320      400      336      416      400
MIN RATE:         0        0        0        0        0        0        0        0        0        0        0        0        0        0        0        0        0        0
AV MOD VARIANCE (8f 9f):  28.4591 29.5935
MAX MOD VARIANCE (8f 9f):  254.000 255.000
MIN MOD VARIANCE (8f 9f):  0.00000 0.00000
MONITOR RATE:   AV VALUE   MIN VALUE   MAX VALUE
PARTICLE_RAT       11.39        1.00      108.00
PREAMP_RESET     1241.83      785.00     3340.00
SHAPER_VALID     1662.78     1323.00     2937.00
SHAPER_OVER_      547.43      237.00     1584.00
DELAY_LINE_V     1743.99     1377.00     3123.00
   LIVE_TIME        0.00        0.00        0.00
AV ROLL PERIOD): 0
AV POINTING SIGMA (x y): 0 0
        FLAG NAME  AV VALUE MIN VALUE MAX VALUE
         SAA_FLAG      0.13      0.00      1.00
     ECLIPSE_FLAG      0.29      0.00      1.00
       FLARE_FLAG      0.27      0.00      1.00
     IDPU_CONTROL      0.00      0.00      0.00
 CRYOCOOLER_POWER    112.00    112.00    112.00
  COLD_PLATE_TEMP     73.00     72.00     73.00
        IDPU_TEMP     76.77     75.00     78.00
COLD_PLATE_SUPPLY      0.00      0.00      0.00
      HV28_SUPPLY    100.00    100.00    100.00
  ACTUATOR_SUPPLY      0.00      0.00      0.00
FAST_HOUSEKEEPING      0.00      0.00      0.00
   SC_TRANSMITTER      3.19      0.00    100.00
   SC_IN_SUNLIGHT     70.37      0.00    100.00
        SSR_STATE      0.00      0.00      0.00
 ATTENUATOR_STATE      1.00      1.00      1.00
      FRONT_RATIO     32.23      0.00     98.00
  NON_SOLAR_EVENT      0.00      0.00      0.00
         GAP_FLAG      0.17      0.00      1.00
DECIMATION_ENERGY      0.00      0.00      0.00
DECIMATION_WEIGHT      1.00      1.00      1.00
   MAX_DET_VS_TOT     17.00      0.00     40.00
Last modified: Thu May 30 23:06:29 PDT 2002