Hi, here we are going to estimate the effect of scattering of X-ray photons by the ND filter on SXT temperature and emisison measure measurements. Before looking at this, you have to read the ND filter Scattering Study . If you're not familiar with the SXT, you should go to the YOHKOH SXT page at Lockheed.
In the the ND filter Scattering Study we learned that: (1) The effective ND filter transmission efficency varies by about 4% over the range from the CCD center to the solar limb. (2) Scattering by the ND filter removes an average of approximately 4% of the photons from the peak of a point source, and results in a point spread function that is approximately 0.1 pixels wider than it would be in the absence of the ND filter. These are small effects, of only a few percent. The expected uncertainty due to photon statistics is rarely lower than 10%, so we expect that and systematic uncertainty caused by the presence of the ND filter will be less than the statistical uncertainty.
As in the original study, we'll start off by looking at data from a single flare, in this case, a flare that occurred on 7-Jan-1992, at about 20:20 UT. As before, we will use the 17 Al.1 images near the end of the flare for our comparison. These images alternate between ND filter images with MBE=4, (exposure times of about 3.1 msec) and OPEN images with MBE=1, (exposure times of about 2.9 msec). For temperature measurements, we will use the Be119/Al.1 filter pair. (Here it turns out that all of the Be119 images are OPEN; this may not be the case for the other flares in the study, but the status of the Be119 filters is not a problem, as long as it remains the same for both the ND and OPEN AL.1 images.)
Again we'll use the radial profiles of the images instead of the images themselves. Recall that the radial profile, A(r), is the amount of emission inside of a circle of radius r, centered at the brightest point of the image. This allows us to collapse the two-dimensional images into one-dimensional plots and generally makes life easier. We really do not want to measure the temperature in the circle inside the radius r, instead we want to measure the temperature at a given radius, so we will define the differential radial profile, Ad(r) = (2*pi*r)-1(dA(r)/dr). This represents the brightness per pixel of the source at the radius r.
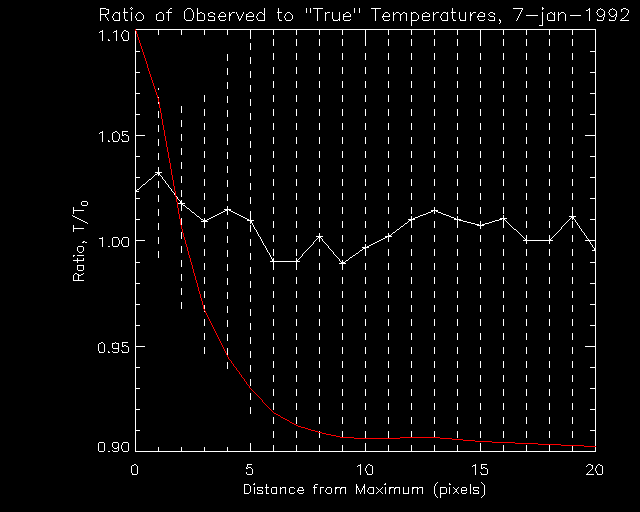
We estimate the effect of the ND filter by calculating A(r) for all of the images, and then interpolating A(r) in time using only the OPEN images, to find A0(r), the radial profile for OPEN images at the times of the ND images. We calculate the derivatives with respect to r after this step, to obtain the differential profiles, Ad(r), and Ad0(r). These are, in turn, used along with the radial profiles calcluated using the Be119 images, to calculate two sets of temperatures, T(r), the observed temperature with the ND filter, and T0, the "true" temperature, as it would be without the ND filter present. The ratio of T and T0 is plotted versus r here in Figure 1. These are averaged over all of the 3.1 msec ND images in the time range with alternating ND and OPEN images. The red line represents the differential radial profile. The dashed lines are error bars representing the fractional statistical uncertainties in the temperature. For most of the range, the statistical uncertainties are much larger than any deviation of T from T0, but close to the brightest point, where the statistical uncertainties are only slightly larger than the deviation of the T/T0 from 1.
Figure 1: The ratio of temperatures, T/T0, for ND filter images.

For the brightest part of the flare (r < 3 pixels), the ND filter scattering causes an overestimate of T by about 2-3%. The ratio decreases and fluctuates at about 1.0, for r > 5 pixels, but by that time the source is less than 1/10 as bright, and the uncertainties are 10to 20%. So for the brightest part of the flare, the ND filter always results in a higher T measurement. Farther from the maximum, the effect is smaller, but still evident.
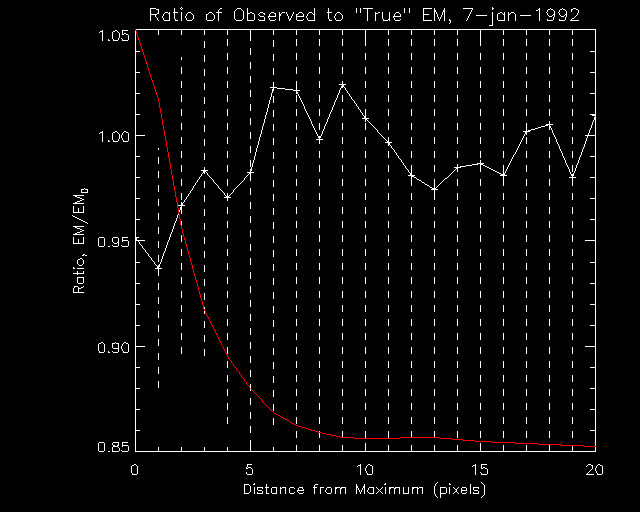
Figure 2 shows the ratio of emission measures for the same flare, and the same time range as figure 1. Since the temperature is overestimated for the ND images, we expect that the EM is underestimated, and this is what we see.
Figure 2: The ratio of emission measures, EM/EM0, for ND filter images.
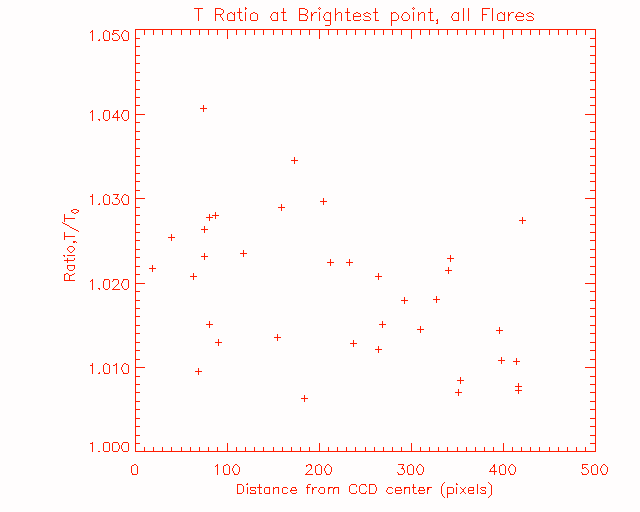
Next we look at the sample of all 36 flares which had the alternating sequence of ND filter images with 3.1 msec exposures and OPEN images with 2.9 msec exposures. A plot of the ratio T/T0 at the brightest point (the circle of 1 pixel radius around the maximum) for all of the flares is shown in Figure 3, plotted versus R, the distance of the flare from the CCD center. (The error bars are left out, since they extend over the entire plot range.) The values range from 1.005 to 1.04, but there is the positional variation due to the variation of the ND filter transmission function with position. We can correct for this, as mentioned in the the ND filter Scattering Study , by dividing the brightness by 1.0+10-4*R.
Figure 3: The ratio of Temperature, at the brightness maximum, T/T0, for the whole sample, versus CCD position.
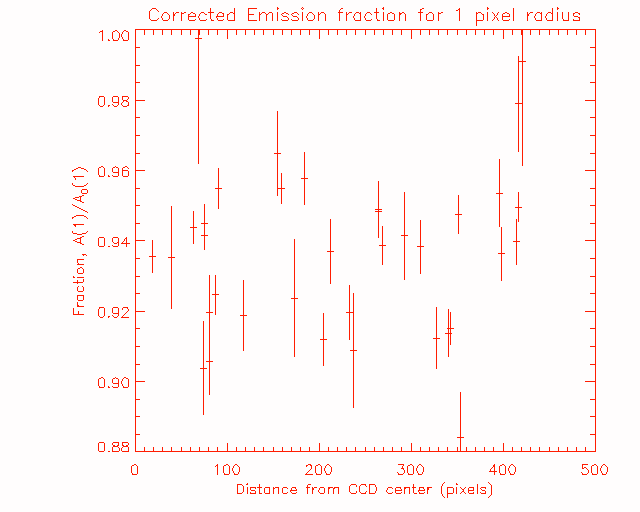
We do this, and show the results in Figure 4, which shows the corrected fraction of the emission inside the circle of 1 pixel radius around the brightness maximum, A(1)/A0(1). This is plotted versus position for all of the flares. You see no more positional dependence.
Figure 4: The position-corrected emission fraction, for the circle of 1 pixel radius around the maximum, A(1)/A0(1), versus CCD position.
Having corrected for positional variation, we can plot the corrected temperature ratio, and this is done in Figure 5. Here we see that the change in the T measurement by th ND filter is between 1 and 5%, with an average value of about 3%. As in Figure 3 we don't show error bars, since they cover the whole plot range.
Figure 5: The ratio of Temperature, corrected for CCD position, at the brightness maximum, T/T0, for the whole sample, versus CCD position.
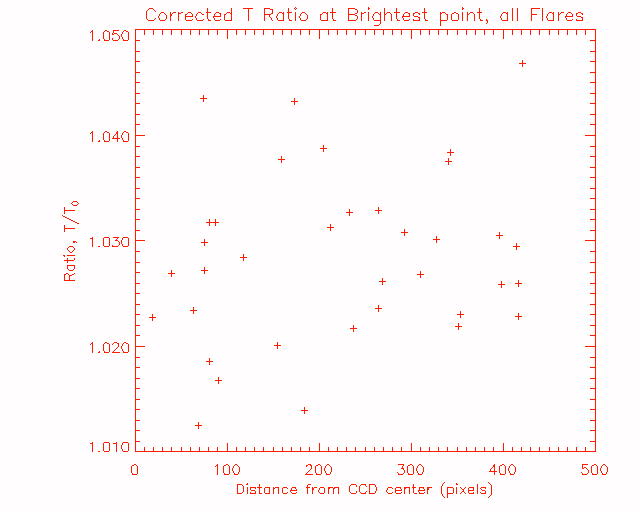
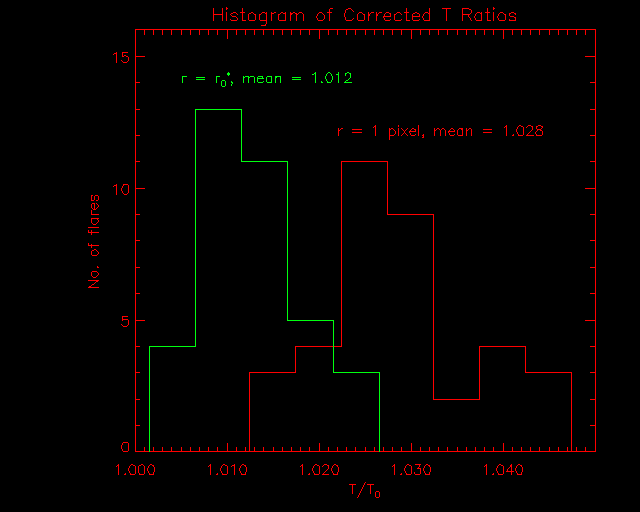
Figure 6 shows a histogram of the same data plotted in the previous figure, and also shows a histogram (green lines) for the temperature ratio at the distance r0* from the maximum. You will recall from the the ND filter Scattering Study , that the source size r0* is defined as the radius of the circle around the maximum that contains 50% of the total emission. At r=r0*, the average ratio is only, 1.012, a 1% difference in the T measurements caused by the ND filter.
Figure 6: Histograms of the ratio of Temperature, corrected for CCD position, at the brightness maximum, T/T0, and at the distance r0* from the maximum.
Here are the conclusions that we can draw so far about the effect of scattering by the ND filter on SXT temperature measurements.
(1) There are small effects, the temperature at the brightest points tends to be overestimated by an average of 3%, this decreases to 1% away from the maximum. The temperature is never underestimated. These oveerestimations are smaller than the uncertainties expected from photon statistics, but they are systematic.
(2) The emission measure is underestimated, too.
Comments to: jimm@ssl.berkeley.edu