Hi, this page will delve into the scattering effects of the ND (Neutral Density) filter on SXT flare images. If you haven't read ND_DEMO, read that. Some of the stuff in that page is repeated here. If you're not familiar with the SXT, you should go to the YOHKOH SXT page at Lockheed. If you want to go directly to the Conclusions feel free. Note that this page will only refer to ND filter effects. Other effects, of the data compression, exposure time, and dark current subtraction (see ND_DEMO for prelimnary results) will be found in later pages.
There are major exposure time effects in SXT images, those will be dealt with in a separate page. Here we will concentrate only on the effect of the ND filter; the best way to isolate the ND filter effects is to choose sets of images for which the effective exposure times are close for both the ND images and OPEN images. During the first two years of SXT this happened often; there are sequences of Al.1 images that alternate between ND filter images with MBE=4, (exposure times of about 3.1 msec) and OPEN images with MBE=1, (exposure times of about 2.9 msec). It turns out that there were 36 flares for which the Al.1 images alternated between 2.9 and 3.1 msec 5 or more times; these are the flares that were used for this study. Unfortunately, the last one of these flares happend on 25-Mar-1992, so there is no good way to deal with data taken after the entrance filter holes.
For this study i'll use the 'radial profile', A(r), which is defined as the amount of emission inside a circular region, of radius r (in pixels) around the maximum. This collapses the two-dimensional images into one-dimensional plots and makes life much easier.
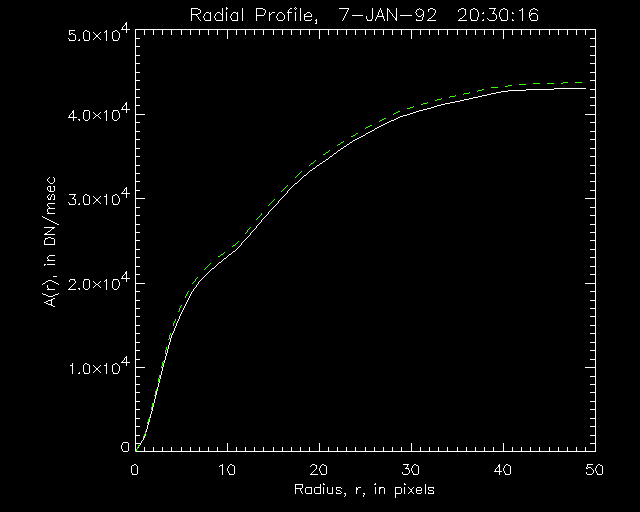
I estimate the effect of the ND filter as follows: First calculate A(r) for all of the images, next interpolate A(r) in time using only the OPEN images, to find A0(r), the radial profile for OPEN images at the times of the ND images. Then we can compare A(r) to A0(r), to find the amount of emission missing in the ND images. Figure 1 shows a plot of A(r) versus r for an image from a flare that occurred on 7-jan-1992. (The units of A(r) are in Data Numbers or DN/msec, DN are units of brightness, related the the number of electrons generated by the X-ray photons in the CCD pixels.) The green dashed line is A0(r), the radial profile interpolated for OPEN images; note that there is slightly more emission in the OPEN case, from 7% at r=1 pixel to 1.6% at r > 32 pixels. Since the ratio of A/A0 increases with r, most of the scattered photons are not scattered out of the image, but are spread around in the image.
Figure 1: The radial profiles, A(r) and A0(r) versus r, 7-jan-1992, 20:30:16 UT.

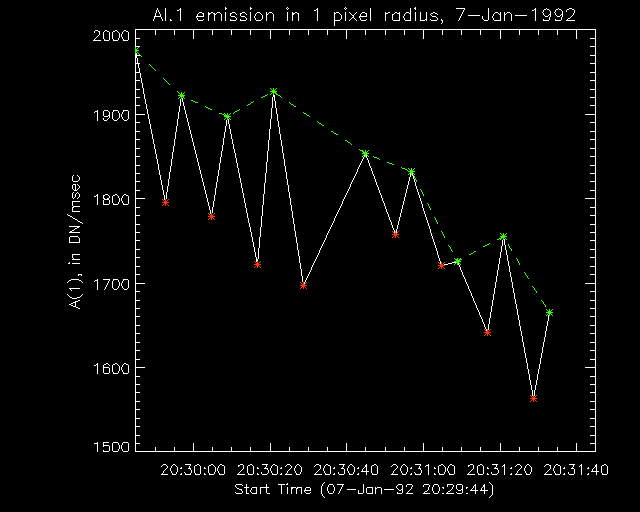
For this flare, the emission in the ND filter images is always underestimated. (This is not true for all flares, as we shall see.) The largest underestimation comes in the brightest pixel. The next plot shows a time profile of A(1), for 17 images which alternate between the ND and OPEN filter configurations. The white line the shows the actual values of A(1), while the dashed green line gives the values of A0(1) interpolated using only the non-ND images. The positions of the ND images are shown by orange stars, and the non-ND images are shown by green stars. As you can see, there is less emission in the ND filter images. The average fraction of OP emission for the ND images is: 0.93, so approximately 7% of the emission has been scattered out of the brightest pixel by the ND filter.
Figure 2: The Emission within a 1 pixel radius of the maximum brightness versus time, for 7-jan-1992.
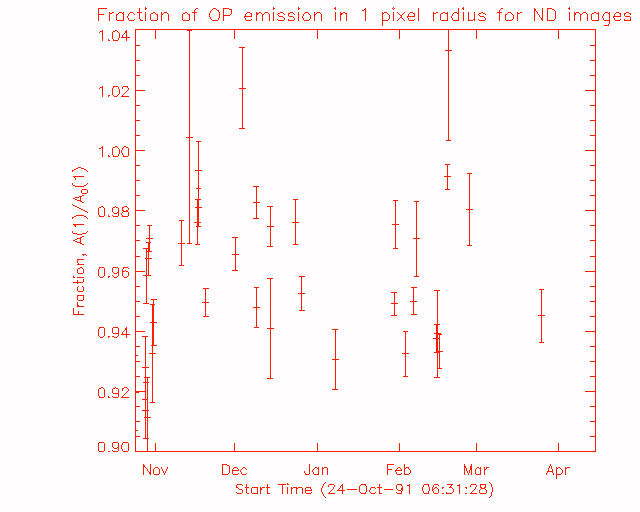
As mentioned above, we have the appropriate data and can do this calculation for 36 flares. Figure 3 is a plot of the average fraction of emission inside the 1 pixel radius, A(1)/A0(1), for all of the flares. For each point, the error bars are given by the standard deviation of the mean value. The average value for all of the flares is about 0.96, but there is a fair amount of variation. Furthermore, some of the values are above 1.0, which means that the ND images actually have more emission in them. This can't be true; the ND filter cannot scatter emission in some cases, and focus emission in others, so there is something else going on.
Figure 3: The average fraction of ND emission within a 1 pixel radius of the maximum brightness for the whole sample of flares.
What's really happenning here is that the ND filter is less effective at absorbing photons as the flare position moves to the edge of the CCD. Figure 4 is a plot of the same data, i.e., the average fraction of emission inside the 1 pixel radius, A(1)/A0(1), plotted versus the distance in pixels from the CCD center, R, for all of the flares. There is a position dependence; limb flares have more ND emission, relative to the OP emission, than disk flares. The dashed line is a fit to the variation, with a slope of 9.66x10⁻⁵ ± 8.5x10⁻⁶.
Figure 4: The average fraction of ND emission within a 1 pixel radius of the maximum brightness for the whole sample of flares versus flare position.
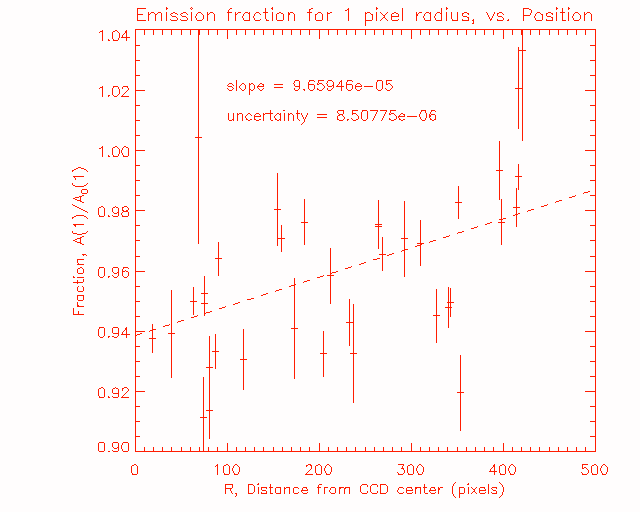
Figure 5 shows the same variation for the whole 64x64 image. The slope of the line fit to the variation is 9.97x10⁻⁵ ± 1.3 x10⁻⁶. The slope varies very little with the radius of the circular region around the maximum, r, i.e., A(r)/A0(r) shows the same variation with flare position for all values of r. Therefore this must be due to a decrease in the absorption efficiency of the ND filter as the distance from the CCD center increases, by a factor of about 10-4*R (where R is the distance in pixels from the CCD center, remember). Over the whole solar disk, this is a variation of about 4%. We can correct for that by multiplying the effective exposure time of ND filter images by 1.0+10-4*R, or multiplying the ND filter transmission value (0.0805) by 1.0+10-4*R (Or dividing the brightness by 1.0+10-4*R). Note that this assumes that the value of 0.0805 for the ND filter transmission is correct at R=0, the center of the CCD.
Figure 5: The average fraction of ND emission in the whole image for the whole sample of flares versus flare position.

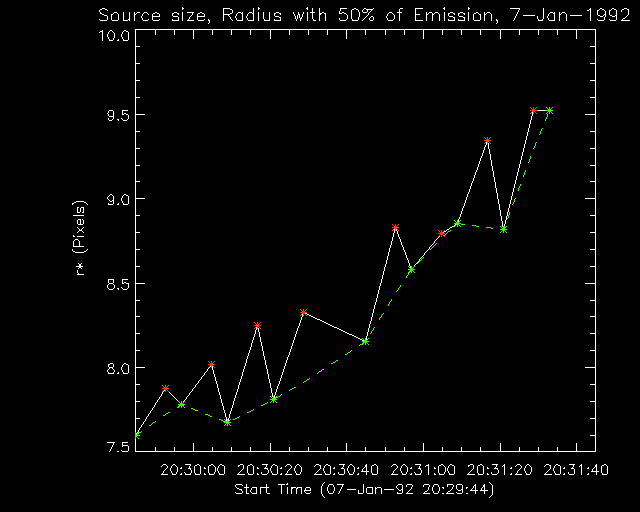
But, what about scattering by the ND filter? In order to test for that we need some measure of the size of the flare sources in the images. We can then compare the source sizes for ND images with OPEN images; if the source is spread out for the ND images, then there is extra scattering. We will define the source size, arbitrarily, as r*, the radius that contains 50% of the total emission (sort of a half-width). Figure 6 is a plot of r* versus time for the same 17 images from the 7-jan-1992 flare as in Figure 2. The plot is organized as in Figure 2, the white line gives the actual values of r*, the dashed green line gives the values of r* interpolated using only non-ND images. The positions of the ND images are shown by orange stars, and the non-ND images by green stars. The ND filter scattering is evident in the higher values of r* for the ND images. That is, if we let r0* be the values of r* interpolated to the ND image times using only the OPEN images, we find that the average value of r*-r0* is 0.32 pixels. (The quantity r0* is the "true" source size, the size in the absence of the ND filter.) The source as imaged with the ND filter is thus 0.32 pixels wider than it would have been without the ND filter. This has to be due to scattering.
Figure 6: The source size, i.e., the radius of the circle that contains 50% of the total brightness, versus time, for 7-jan-1992.
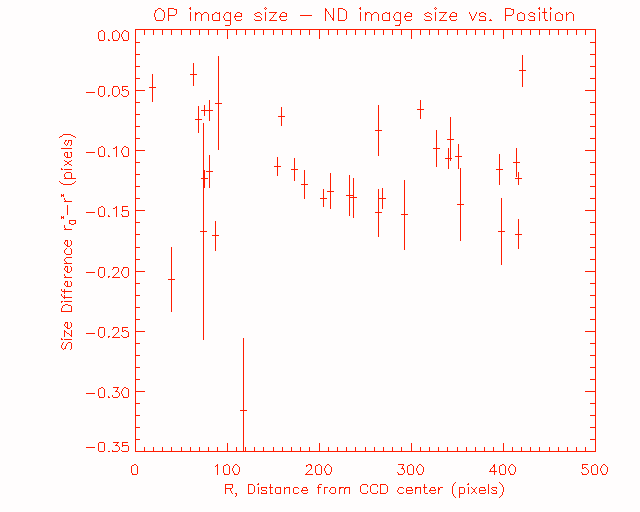
We can, of course, plot the value of the difference in ND and OPEN image sizes for all the flares, and that gets done in Figure 7, which shows the difference in source sizes of the OPEN and ND images, r0*-r*. For all of the flares this value is negative, this means that the ND size is always larger than the OPEN image size. The value of -0.32 pixels obtained for the 7-jan-1992 is much larger than the typical value, which is usually between -0.05 and -0.17. The average value is -0.12. (There is a slight anti-correlation between the size difference and size; larger flares show a slightly smaller size difference, but the variation is too small to effect this analysis.) Note that there is no position dependence here, so the effect of the variation of the ND filter transmission efficiency with position has no effect. So here we have truly discovered the effect of scattering by the ND filter; the ND filter spreads out sources by some small fraction of a pixel.
Figure 7: The difference in source size, r0*-r*, versus CCD position, for all of the flares.
Since the source size is larger for ND filter images, it must be that the ND images have less emission inside the OP source size. This is true. We can find the fraction of emission remaining the circle of radius r0* for ND images by normalizing A(r), by the total emission, Anorm=A/max(A). Since photons have been scattered out of the circle, Anorm will be less than 0.50 at r0*. (Note that the use of A for the normalization factor instead of A0 removes the CCD position dependence.) Figure 8 is the plot of Anorm(r0*), versus r0* for all of the flares. As you can see, all of the values are less than 0.50, so there is indeed ND filter scattering present. This scattering can remove a few percent of the photons. For the smallest sources, only 5 or so pixels wide, about 0.487 of the emission remains inside the small sources, so 2.6% of the original source photons have been scattered out.
There is also a correlation with the source size, for larger source sizes, less emission is scattered out. This makes sense, since there is only a small amount of correlation between the size difference, r*-r0* and r0*. An overall difference in size of 0.1 pixels will have a much smaller effect on sources which are 10 to 20 pixels wide, than it will have on sources which are 5 pixels wide.
Figure 8: Normalized emission remaining in the circle of radius r0*.
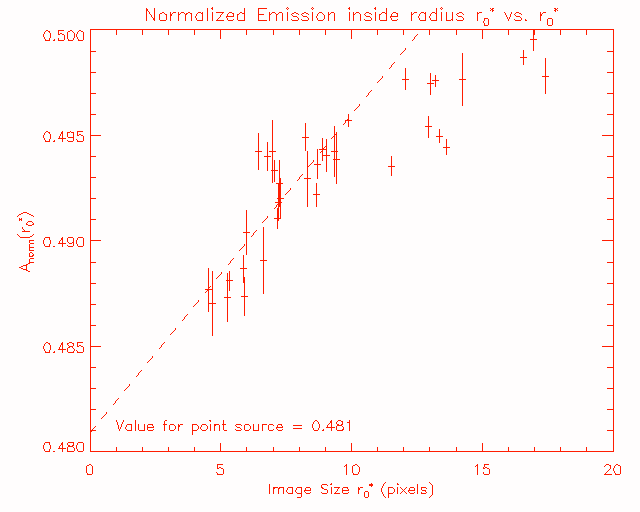
Since the fraction of emission decreases with decreasing source size, we can estimate the fraction for a point source, by fitting a line to the data, and extrapolating to r0*=0. This is represented by the dashed line on the plot. From this we obtain a fraction of 0.481. So approximately 4% of the emission would be scattered out of the point source; (0.5-0.481)/0.50 = 0.038. So we have some idea about what effect the ND filter has on the SXT point spread function; it makes the point source wider by about 0.1 pixels (see Figure 7 above), and decreases the maximum by about 4%.
Ok, we finally have some conclusions about the effects of the ND filter on flare images. Note that right now, these only apply to AL.1 images and they only apply to images taken before the entrance filter hole of November, 1992.
Based on the study of alternating ND and OPEN images with effective exposure times of 3.1 msec and 2.9 msec, for 36 flares between Oct-1991 and Mar-1992, we find.
(1) The effective ND filter transmission efficency varies by about 4% over the range from the CCD center to the solar limb. This can be corrected for by multiplying the ND filter transmission value or the effective exposure time by 1.0+10-4*R, where R is the distance in pixels from the CCD center. Note that this assumes that the value of 0.0805 used for the ND filter transmission is correct at R=0.
(2) Scattering by the ND filter removes an average of approximately 4% of the photons from the peak of a point source, and results in a point spread function that is approximately 0.1 pixels wider than it would be in the absence of the ND filter.
(3) These are small effects, of only a few percent. In any calculation of Temperatures or Emission Measures, the uncertainty due to photon statistics will be larger. This will be shown in another page entitled "Effects of ND filter scattering on SXT Temperature Measurements"
Comments to: jimm@ssl.berkeley.edu