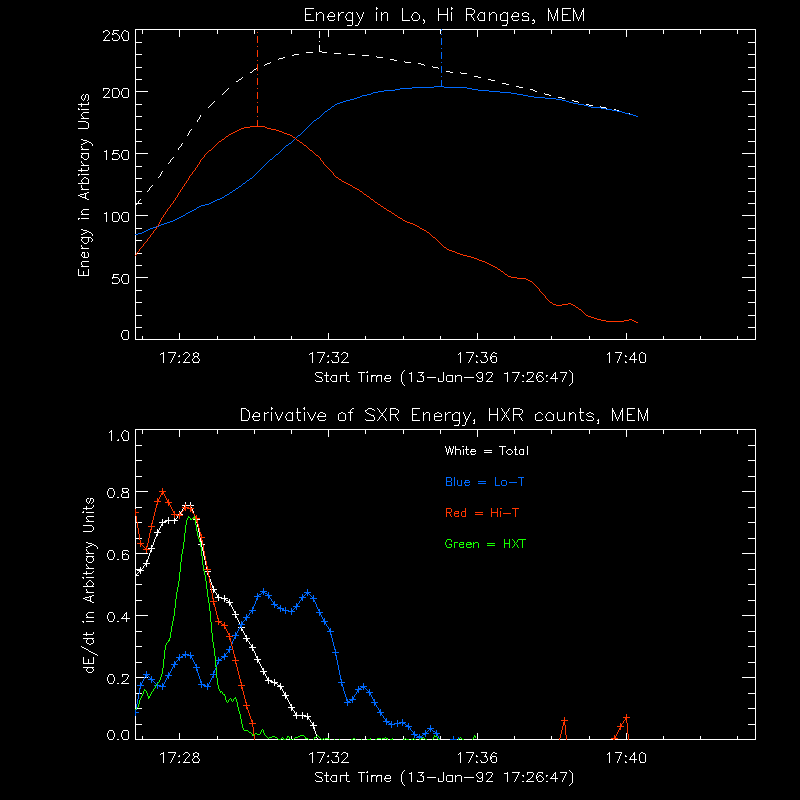
Figure 1. Top--The thermal energy (actually the square root of the integral over dT of T2 times the DEM) as a function of time for the 13-Jan-1992 flare, total (white dashed lines), high-T (red line), low-T (Blue line). Dash-dot vertical lines indicate the peaks for the different components. Bottom--The time derivatives of the energy for each component (same colors), plotted along with the hard X-ray time profile as seen in the HXT-M2 and HI channels (arbitrarily scaled, green line), covering the energy range above 33 keV.
The bottom plot shows the time derivatives for each component, compared with the 30 keV hard X-ray time profile as seen by the HXT. The color scheme is the same, and as you can see, the total energy and high-T component look similar to the HXR burst. The high-T derivative peaks before the HXR's and goes to zero at the end of the HXR burst, consistent with the Neupert effect. The total energy derivative is positive until 2 minutes after the HXR burst. This implies that there is another heating source along with nonthermal electrons. The low-T component behaves a bit differently. Its derivative has a small peak at the same time as the HXR peak, but it remains positive for 5 minutes after the HXR burst. This late increase in low-T plasma is due to cooling of the high temperature plasma, not heating, since the total energy is decreasing by this time.
How do we interpret this in terms of chromospheric evaporation? Here's my try at it: The electrons pump up plasma to high (> 18 MK) temperature. Some of the HXR electron energy goes into low-T plasma. At the same time, there's a more gradual heating mechanism, unrelated to the hard X-rays, that is slowly heating low-T plasma; this extra heating lasts until 2 minutes after the HXR burst.
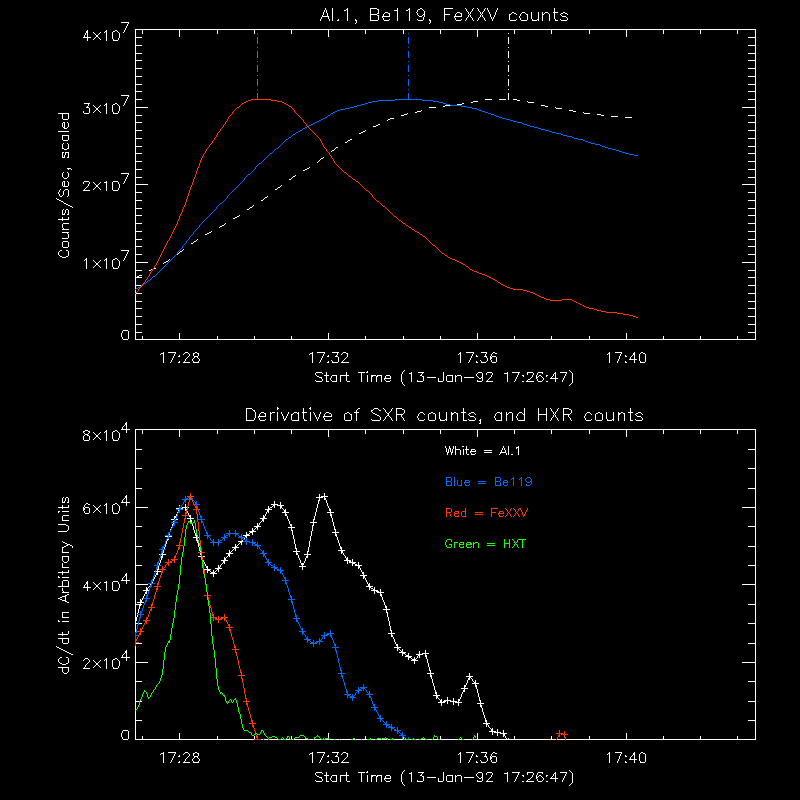
You can see the effect of how the DEM varies with time in the SXT and BCS data. The top plot of Figure 2 shows the data from the Al.1 (white) and Be119 (blue) filters of SXT, and the FeXXV channel of BCS (red). The bottom plot shows the time derivatives of the data, along with the HXT data. For this case, the curves have been arbitrarily scaled. The FeXXV channel is only sensitive to high T plasma, and its derivative closely follows the hard X-ray time profile. (You can find plots of the temperature responses in the SPD 97 poster .) The Be119 filter is sensitive to low and high T plasma; its derivative has a peak with the HXR burst, and remains positive long after the HXR burst. The Al.1 filter is sensitive to high and low T plasma, but is much more sensitive to low T plasma than the Be119 filter. Its derivative has a peak with the HXR burst, but also has a peak long after the HXR burst. Al.1 brightness increases (i.e., has a positive derivative) until 17:37 UT. The late increase in Al.1 counts isn't due to extra heating, however; the total energy decreases after 17:32 UT. Instead, it's due to cooling of the high T plasma, and the corresponding increase in low T plasma. The plasma moves into the temperature range where the Al.1 filter is more sensitive, and the Al.1 brightness increases, even though the total energy in the plasma is decreasing.
Figure 2. Top--SXT-Al.1 brightness (dashed white line), Be119
brightness (blue line), and BCS-FeXXV brightness (red line), for the
13-Jan-1992 flare, scaled arbitrarily. Dash-dot vertical lines
indicate the peaks for the different curves. Bottom--The time
derivatives for each curve, along with the HXT-M1 data (green line).
The lesson here is that you need to look at the DEM before you can
discuss whether there is extended heating. If, for example, you only
look at SXT Al.1 data, you may decide that heating lasts for a long
time after the HXR burst. If you only look at the BCS FeXXV data, you
decide that the heating ends with the HXR burst. In reality, the
answer is somewhere in between.
Now that we have a reasonably neat explanation for how the Neupert
effect works in some cases, let's look at a flare where it doesn't
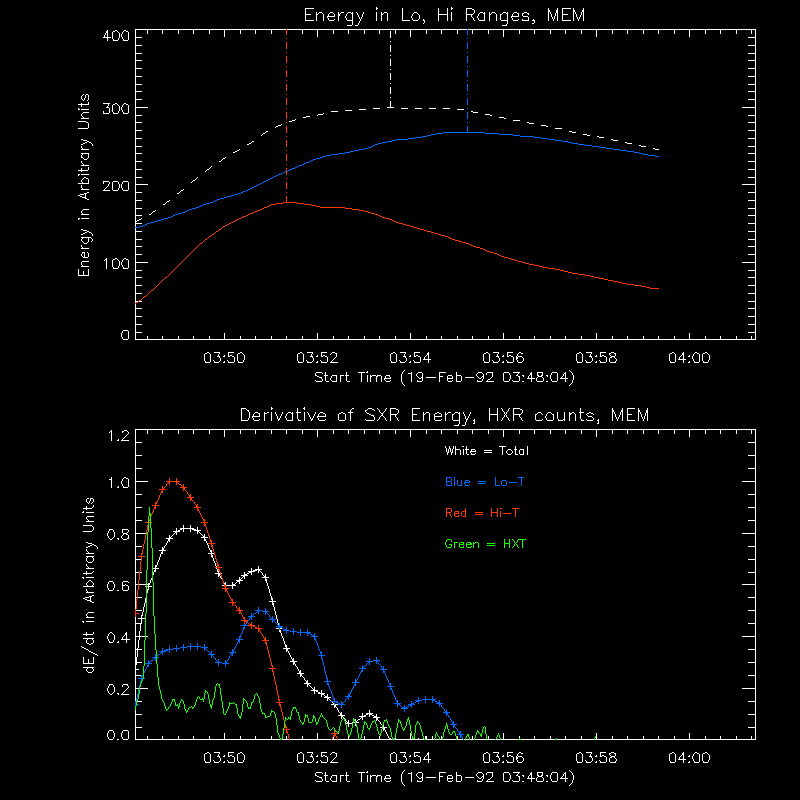
work so well at all. Figure 3 has the same format as Figure 1, for a
flare that occurred on 19-Feb-1992. Note that the DEM for this flare
never showed a high-T hump. The top plot is of the energy in the SXR
plasma. The white dashed line shows the total energy, the red line
shows the energy in high temperature plasma (T > 18 MK), the blue
line shows the energy in low temperature plasma (3 MK < T < 18
MK). The bottom plot shows the time derivatives for each component,
compared with the > 33 keV hard X-ray time profile as seen by the
HXT.
Figure 3. Top--The thermal energy (actually the square root of the
integral over dT of T2 times the DEM) as a function of
time for the 19-Feb-1992 flare, total (white dashed lines), high-T (red
line), low-T (Blue line). Dash-dot vertical lines indicate the peaks
for the different components. Bottom--The time derivatives of the
energy for each component (same colors), plotted along with the hard
X-ray time profile as seen in the HXT-M2 and HI channesl (arbitrarily scaled,
green line), covering the energy range above 33 keV.
Here, none of the derivatives look like the HXR time profile, and
they all remain positive after the HXR emission is gone. The
derivative of the high-T component and the total energy peak about 1
minute after the HXR peak, just after the end of the HXR burst. The
low-T component derivative has a smaller peak at this point, and a
higher peak later in the flare. The behavior of the low and high-T
components relative to each other is similar to the 13-Jan-1992 flare,
but their relation to the HXR time profile is different. Odd.
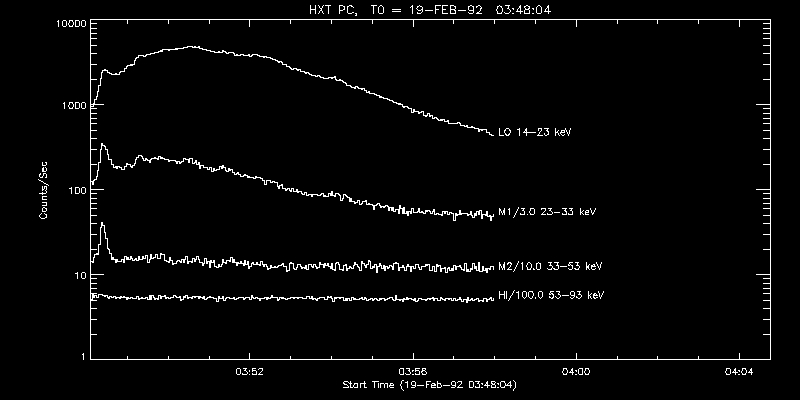
Figure 4 shows the time profile for all of the HXT channels for
the 19-feb-1992 flare. From this we can see that there is a gradual
hard X-ray component seen in the two low energy channels. Gradual HXR
bursts such as the one in the 19-feb-1992 flare are typically assumed
to be thermal for two reasons: (1) It's gradual, like the thermal soft
X-ray flare, and (2) there's an extremely soft spectrum; no emission
above 33 keV, and temperature measurements made using the HXT alone
give values of about 20-30 MK (A "superhot" component). If the gradual
HXRs are due to thermal emission, then there's no way that this flare
is consistent with the Neupert effect.
Figure 4. HXT data, all four channels, for the 19-feb-1992 flare.
Of course, the gradual HXR burst doesn't have to be
thermal. If it's nonthermal, then you could say that this flare is
consistent with the Neupert effect. I personally wouldn't bet on it.
So what can we conclude from this work? First, we can say that for
many flares, in particular those (18 out of 79 analyzed so far) which
have distinct high-T components in the DEM, the Neupert effect applies
to high-T plasma, and not necessarily to the Low-T plasma. Typically
there is some heating that exists after the HXR burst is gone, thus all
of the soft X-ray plasma is not due to "chromospheric evaporation".
And some flares do not seem to fit well with the Neupert effect at all.
Still a work in progress.
Comments to: jimm@ssl.berkeley.edu
16-Oct-1997, jmm

Sometimes it doesn't


Conclusions