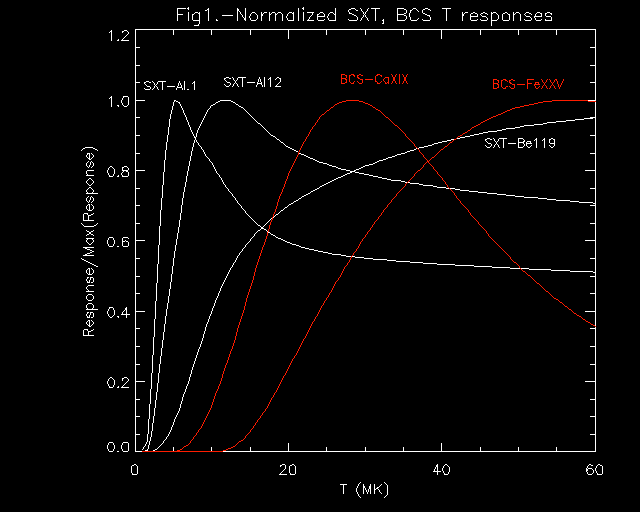
Figure 1. The normalized T response for the SXT filters and BCS channels used. The SXT response curves are white, the BCS responses are in red. Note that the SXT responses extend to high temperatures. Since the T responses are so broad, we do not expect to resolve features in the DEM smaller than a few MK. The BCS responses are obtained using the IDL program BCS_SPEC, which is distributed as part of the SolarSoft software package . The solar coronal abundances used in the SW are adapted from Meyer, J.-P. 1985, Ap. J. Supp. 57, 173.
The analysis was carried out for 92 flares which occurred between October, 1991 and November, 1992. These were chosen from an earlier sample of flares used to obtain the variation of Emission Measure versus Temperature for SXT and GOES, and were chosen so that the peak of emission in each channel/filter was available.
A number of different models for the DEM have been tried, with varying results. Two-temperature models work fairly well for many flares, particularly early in flares. During the flare decays, models for which the DEM is a monotonically decreasing function of temperature often work well. For a number of flares, no model fit the data particularly well; in many of these cases it is obvious that there is a source seen by the BCS, a full-sun instrument, that is not present in the SXT data; in other cases, there are different data gaps for the two different instruments, which are too large for interpolation; for large flares, there may have been saturation problems in the BCS channels; for a few flares, it was clear that there was a high temperature component that was seriously underestimated by the simple DEM models; for some flares there seems to be no reason at all why the data is not fit, these will be dealt with in the future. Note that by ``a good fit'' we mean a reduced chi-squared value of approximately unity, after assuming a systematic error of 5% in the photon flux (poisson errors for the large number of photons involved here are smaller than that). So a ``good fit'' means that the photon fluxes in each channel/filter are within a few percent of the observed data, for the entire flare.
The final sample contains 64 flares.
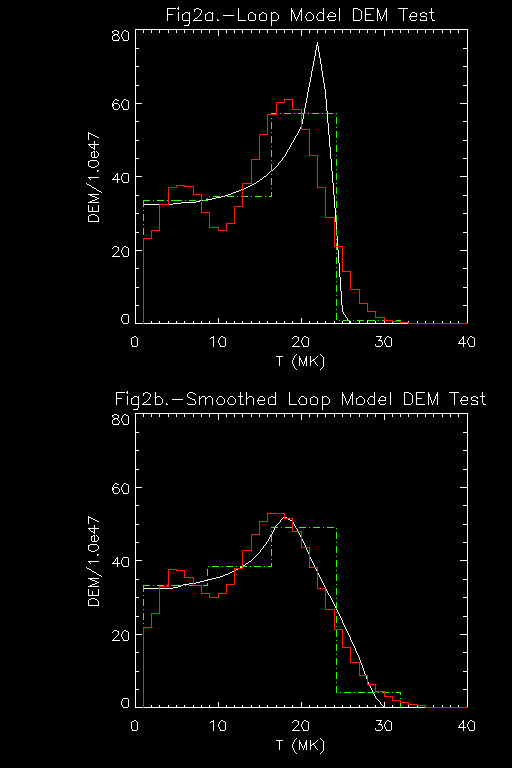
Since both two-component and monotonically decreasing functions seem to fit the data for different flares and time intervals, a model that can show both kinds of behavior is a good thing. We divide the temperature range into 4 bins and assign an emission measure to each bin. The amount of EM in the bins is varied to minimize chi-squared. (We use four bins since we have five data points to work with.) This histogram-DEM usually fits the data fairly well, but we can improve the solution by using it as the starting point for a Maximum Entropy Method (MEM) calculation. (The MEM algorithm is the same as that used for HXT images, see Sakao, 1994.) A sample is shown in fig. 2, in which we compare the fitted DEMs with a flare loop model. Note that the units of all DEMs here will be EM/(1047 cm-3) per MK, so that the total emission measure is the integral of the DEM over T, not ln(T) as is often used.
Figure 2. Top panel, a flare loop model DEM, with fits. The green
dot-dash line is a histogram fit to the model, in 4 bins. The red
histogram with 1 MK bins is an MEM fit to the data. The true loop
model (top panel) has a high-temperature cusp, with a peak at the
temperature of the loop apex; MEM does not fit sharp features very
well, and it does not fit the the high temperature cusp. In the bottom
panel, the high temperature cusp of the input DEM has been smoothed,
and the MEM method fits the smooth maximum very well. This is typical
for MEM algorithms. The model is a ``static'' loop model of Fisher
& Hawley, 1990.
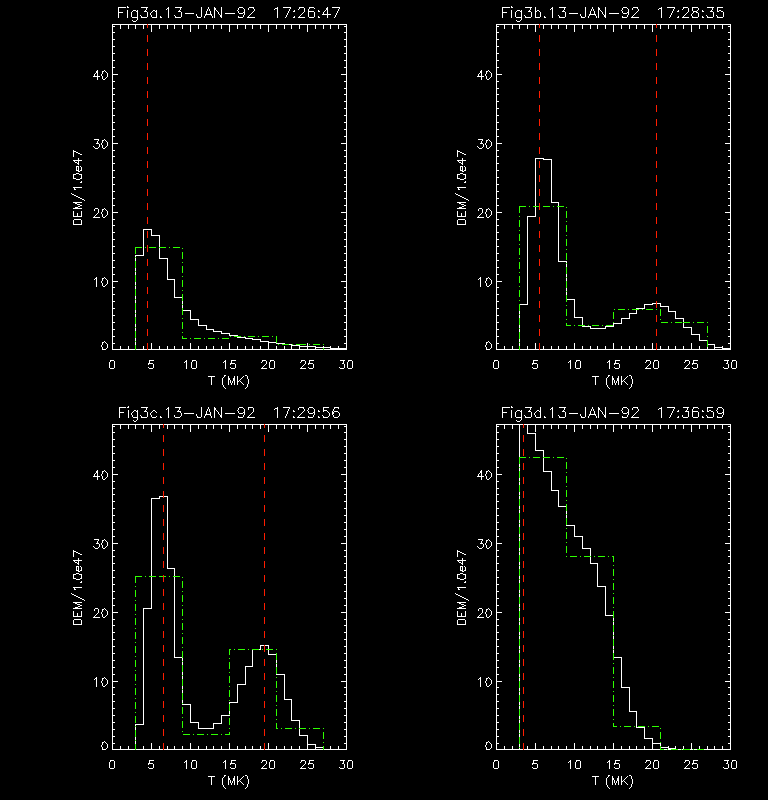
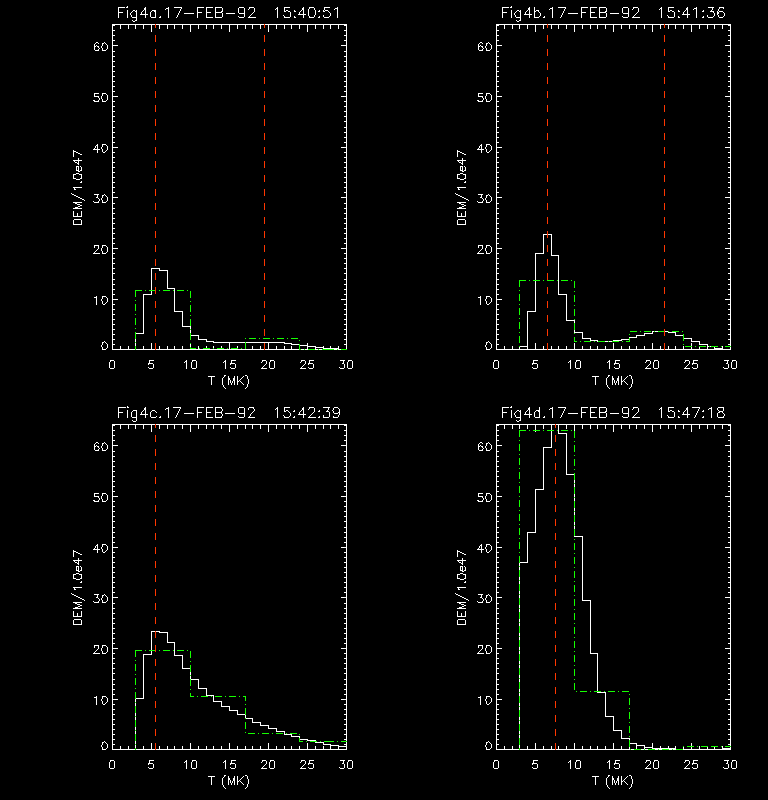
Results for real flares only occasionally look like model results
(not truly surprising). DEMs for single-loop limb flares of 13-Jan-92
and 17-Feb-92 are shown in fig. 3 and fig. 4. Loop models typically have a DEM that
increases with T, (see fig. 2) and the flares
have DEMs that decrease with T. In both cases, there is a distinct
high temperature hump in the DEM. This happens for 18 of the 64
flares. When the hump is present, the results look very much like some
results obtained from SMM data for a flare of 8-Apr-80 by Strong et
al. 1986. The high T component pops up, then increases in emission
measure, while decreasing in temperature, until it merges with the low
T component. The mean temperature of the low T component remains
relatively constant. The behavior is qualitatively similar for the
cases which do not show a distinct high T hump. The high T DEM looks
like an extended tail on the low T DEM, and it eventually merges with
the low T component.
Figure 3. The DEM for different times for the flare of
13-Jan-1992. The green dash-dot line is the histogram-DEM, and the
solid line is the MEM-DEM. The values of the temperature for the
different components are given by red dashed lines. The four plots
correspond to: a) the first SXT Al12 flare-mode image; b) the maximum
T for the high T hump; c) the BCS-FeXXV channel maximum; d) the
SXT-Al.1 maximum. The high T component is really prominent
here. Notice how the peak of the high T component decreases with time
as the emission measure increases; the two components merge later in
the flare. The temperature of the low T peak does not vary much at
all, staying at about 5-6 MK until late in the flare. The results do
not look much like loop models, for which the DEM increases with T.
Figure 4. The DEM for different times for the flare of
17-Feb-1992. The format is the same as in
fig. 3. Here the high T hump is much less prominent, but the
temperature peak (peak T's are denoted by the vertical red dashed
lines) is higher, at 22 MK, and there is some DEM above 25 MK. Only 18
out of the 64 flares analyzed showed distinct high T humps, but all
flares showed some emission measure in the 20 MK range. The low T
component has a relatively high temperature, roughly 6.5-7 MK, as
opposed to 5-6 MK for the 13-Jan-92 flare.
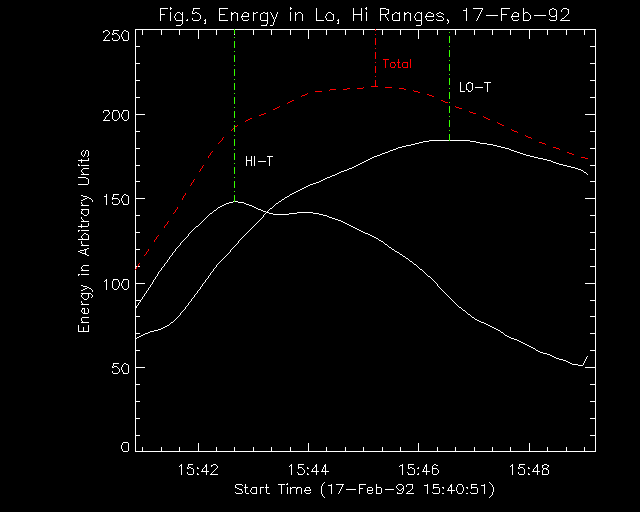
Even though the high T component looks small, it can carry a
substantial amount of energy. The energy is plotted for the 17-Feb-92
flare in fig. 5, for low and high temperature
ranges.
Figure 5. The thermal energy (actually the square root of the
integral over dT of T2 times the DEM) as a function of time for
the 17-Feb-1992 flare. The red dashed line represents the total
energy, and the solid lines are for the low and high temperature
ranges, arbitrarily divided at 15 MK. Dash-dot vertical lines indicate
the peaks for the different components. The energy in the > 15 MK
plasma peaks at approximately 15:42:40 (that's right at the end of the
hard X-ray impulsive phase, for all of you Neupert Effect buffs), the
low T energy peaks a few minutes later, and the total energy, being
the sum of the two components, has a peak somewhere in between. Note
that all of the energy does not go into the high energy component
first. Some, but not all, of the late rise in the low T energy can be
attributed to cooling of the high T component, as the two components
merge late in the flare. The total energy increases for approximately
2 minutes after the end of the impulsive HXR burst; this may require
additional heating beyond that expected from HXR electrons.
The high T stuff peaks earlier, and cools faster. The original
motivation for all of this was to see how the plasma cooling time
varies as a function of T. For the 17-Feb-92 flare shown in fig.5, the e-folding cooling time is 450 sec for
the high T component. The BCS flare-mode observations did not last
long enough for us to get a reasonable cooling time for the low T
component; we end up using SXT Al.1/Al12 observations, and obtain a
cooling time of 500 sec for the low T component. So if the cooling
time is proportional to Tq, then a is approximately
-0.25. For conductive and radiative cooling, q=-2.5 and 1.5
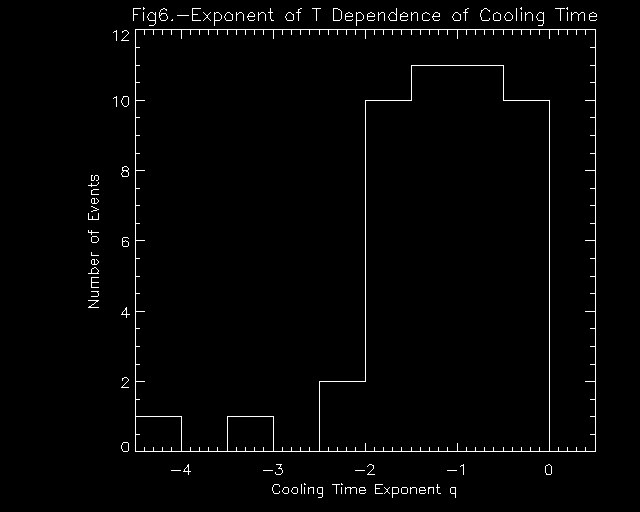
respectively. We found cooling times for 46 of the 64 flares; a
histogram or q is shown in fig. 6. We see that
q mostly ranges between 0 and -2; this looks more like conductive
cooling than radiative cooling, but it could be a combination of the
two processes.
Figure 6. A histogram of the exponent, q, of the temperature
dependence of the cooling time. We were able to do this calculation
for 46 of the flares analyzed. In most cases, SXT Al.1/Al12 data was
used to obtain the low T cooling time, since the BCS observations
rarely last long enough for us to obtain DEM models for the long times
needed for the low T component to lose a significant amount of
energy. The values of q vary, but most are in the range between 0 and
-2. The negative values of q show that the high T component cools
faster than the low T component. This is characteristic of conductive
cooling, although the absolute value of q is not as large as is
expected from pure conductive cooling, for which q=-2.5
The main conclusions that should be drawn from this work are:
(1) The solar flare soft X-ray plasma is not isothermal. DEMs for
solar flares can be obtained using SXT and BCS data.
(2) The DEM typically decreases with T; some flares show humps in
the high T DEM, but these are smaller than the low T peaks. This is
not what we expect from loop models, for which the DEM increases with
T.
(3) Even though the DEM is smaller for high T, there can be a
substantial amount of energy in the high T plasma. It should be noted
that all of the energy does not go to the high T component.
(4) Higher temperature plasma peaks earlier and cools faster.
This is a characteristic of conductive cooling.
This work was supported by Lockheed Subcontract SE80D786OR and NASA
grant NAGW-5126
Fisher, G.H. & Hawley, S.L. 1990, Ap. J., 357, 243.
Sakao, T. 1994, Ph.d. Thesis, Univ. of Tokyo.
Strong, K.T., Bentley, R.D., Bornmann, P.L., Bruner, M.E.,
Cargill, P.J., Doyle, J.G., Lemen, J.R., Pallavicini, R., Peres, G.,
Serio, S., Simnett, G.M., Sylwester, J., Veck, N.J., 1986, in
Energetic Phenomena on the Sun, The Solar Maximum Mission Flare
Workshop Proceedings , NASA Conference Publication 2439, Section
5.3.
Onwards to the Neupert as a function of T?
Comments to: jimm@ssl.berkeley.edu
Results
Conclusions
References
18-Aug-1997, jmm