SatTrack

SatTrack an orbit dynamics software package used at the MOC for real-time satellite tracking and space environment visualisation. The specific features of the software can be seen in the SatTrack main/control bar (SatTrack suite).


SatTrack Suite


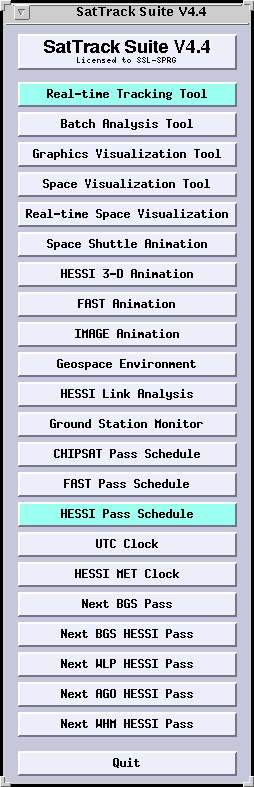
Real-time Tracking Tool - Displays a window from which the World Map (see below) window can be called. Also provides real-time tracking information (such as current azimuth, elevation, velocity, etc.) updated every second for any object in the database.

Batch Analysis Tool - Allows for various analysis to be perfomred by SatTrack. One of its most useful features is the generation of Contact Schedules. This can be done by clicking the button to open the Batch Analysis Window and setting the av ailable options appropriately before hitting the RUN button. To generate contact schedules for RHESSI at the Berkeley Station

  • set FCL to BGS
  • set OBJ to HESSI
  • set Time Zone to -7
  • enable stn mask
then click RUN. The schedule can be printed out to the default printer by clicking PRINT or simply viewed through a terminal window through the VIEW button.

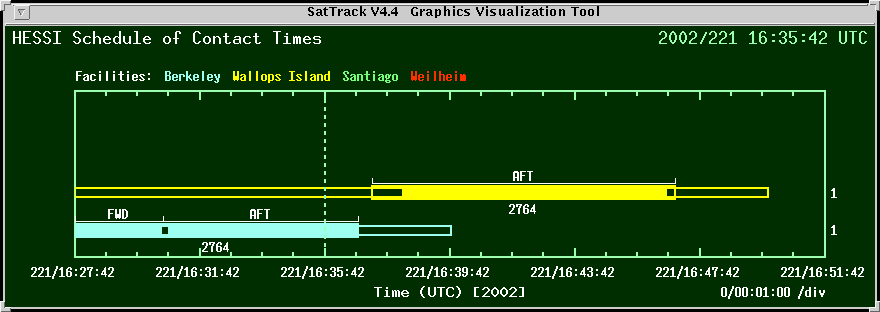
HESSI Pass Schedule - Displays the HESSI pass schedule window (see below).


Real-time Tracking Tool Display window


RHESSI pass schedule window


Solid bars represent times when data can be received by a ground station.

Empty bars represent times when, though the satellite is over the ground station, data cannot be transmitted.

Two antennas are used for transmitting signals from the satellite: the forward antenna (FWD) and the AFT antenna. Which antenna is used for transmitting affects count rates (see monitor_rates). When receiving with the AFT antenna, count rates in both front and rear segments of the GeD 8 are abnormally high. Also, note the gap when switching from FWD to AFT antenna; during this gap, no data can be received.


World map display


Space view of RHESSI orbit


tohban@ssl.berkeley.edu