EVE Observations of Flare Footpoints
From RHESSI Wiki
Contents |
Introduction
Impulsive emission during solar flares is typically observed at optical and UV wavelengths in the form of ribbons or footpoints in the chromosphere, as well as hard X-ray emission observed by RHESSI. Studies from Yohkoh/SXT were among the first to show that impulsive emission can also be observed in soft X-rays indicating that material at flare footpoints was heated up to temperatures of around 10 MK [1]. The presence of hot material at footpoints has also been recently confirmed in spatially resolved spectroscopic EUV studies, indicating peak footpoint temperatures of ~8 MK [2]. The EVE instrument [3] onboard SDO obtains Sun-as-a-star spectral observations over a wide wavelength range and at high cadence. It observes emission lines from ions formed over a wide range in temperature and the nearly 100% duty cycle allows for time-resolved studies of many solar flares. In a recent study by Chamberlin et al. [4] the capabilities of the EVE instrument were used to study the radiative emissions of several flares as a function of temperature. In one of the events studied, it was noticed that emission from ions formed up to temperatures of ~ 3 - 4 MK exhibited increases during the impulsive phase that were co-temporal with He II emission, then declined before increasing again to a second peak in the decay phase as the hot flare loops cooled. The impulsive time profile and correlation with the emission from ions formed at chromospheric and transition region temperatures suggested that this impulsive 'hot' emission observed by EVE was also originating from the lower layers of the atmosphere in the early stage of the flare. If this is the case, then EVE observations, despite being spatially unresolved, could potentially be used to determine the properties of the flaring chromosphere in response to energy deposited by non-thermal electrons.
Observations
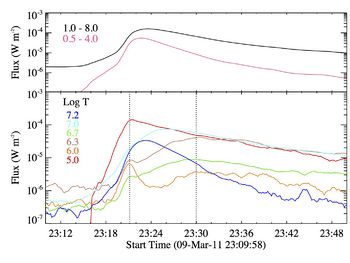
An analysis of a large sample of flares was performed to investigate whether the observed impulsive phase increases were a common feature in the EVE flare light curves and to determine the emitting region in the solar atmosphere. Adopting a method based on that of Chamberlin et al [4], the radiative emission of flares was studied as a function of temperature by binning the flux of unblended emission lines together as a function of their peak line formation temperature. An example of the resulting light curves is shown in Fig. 1 for the 2011 March 09 X-class event (SOL2011-03-09T23:23). In this flare, strong impulsive increases from ions formed at ~1 MK, as well as weaker increases at temperatures up to ~5 MK, were found to be coincident with increases in chromospheric He II emission. From the analysis of over 400 flares, it was found that approximately one quarter of all events studied had light curves which exhibited the similar feature of enhanced impulsive high-temperature emission in the disk-integrated EVE observations. The highest X- and M-class events that exhibited this emission feature were selected for further analysis.
Imaging of the Flare Emission
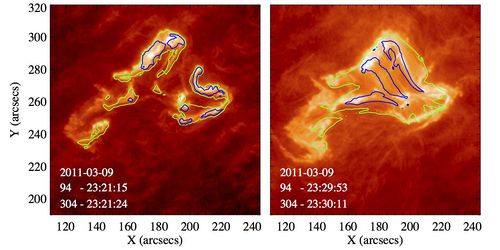
Imaging of the flare from AIA was used to verify the emitting location of the impulsive emission observed by EVE. Images from the AIA 304 channel (He II, Log T = 4.9) are shown in Figure 2 at two points in the flare evolution. The left panel shows the peak of the impulsive phase while the right image was taken during the decay phase. The time of these images are marked in Fig. 1 by the two dotted lines. Overlaid on each of the 304 images are intensity contours from the 94 channel (Fe XVIII, Log T = 6.9) at the 10% and 50% levels (green and blue respectively). During the impulsive phase the intensity contours from the 94 channel outline the flare ribbons with the highest intensity emission occurring from several localised regions. Later in the flare decay phase the emission is originating from the coronal loops. The morphology of the emission is similar in other AIA passbands and appears to indicate that the majority of the EUV emission during the impulsive phase of the flare is originating from the flare ribbons and footpoints.

Flare Differential Emission Measure
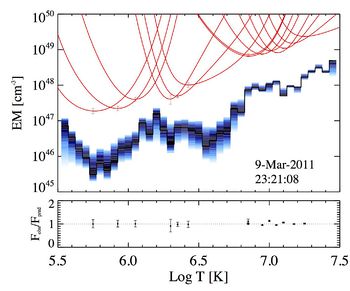
A differential emission measure analysis was performed to investigate the distribution of material as a function of temperature. The DEM is a tool which is potentially useful in discriminating between flare heating mechanisms and, as the imaging indicates EVE is observing EUV emission from the flare footpoints and ribbons, the DEM may help determine the energy balance of these regions during the impulsive phase. To construct the flare DEMs, we adopt the well known MCMC method from PINTofALE [5]. Emission lines from Fe VIII to Fe XXIV allowed the DEM to be constructed over a temperature range of Log T = 5.5 - 7.5, however due to the low spectral resolution of EVE many emission lines are blended and there are few lines that are useable to constrain the DEM at low temperatures. For the 2011 March 09 flare the DEM was calculated at the peak of the impulsive phase. The solution is plotted as an emission measure distribution (EMD) and the blue shaded region represents the 1-sigma uncertainty at each temperature bin. At low temperatures the EMD increases to a peak at 1 MK, then declines reaching a minimum at 4 MK. The distribution is then increasing with a broad high temperature component from 7 - 30 MK. Studies of other events show a similar temperature distribution in the impulsive phase.

Conclusion
We have used the EVE instrument to study the radiative output of solar flares as a function of temperature. Light curves created from disk-integrated EVE observations show signatures of impulsive emission originating from flare footpoints. Though EVE observations are spatially unresolved, the verification of the emitting region using AIA would indicate that EVE can be used to determine properties of the footpoints during the impulsive phase. A preprint of the manuscript this nugget is based on is available on astro-ph [6].
References
- "Impulsive behavior in solar soft X-radiation"
- "The Emission Measure Distribution of Impulsive Phase Flare Footpoints"
- "Extreme Ultraviolet Variability Experiment (EVE) on the Solar Dynamics Observatory (SDO)"
- "Thermal Evolution and Radiative Output of Solar Flares Observed by the EUV Variability Experiment (EVE)"
- "Markov-Chain Monte Carlo Reconstruction of Emission Measure Distributions: Application to Solar Extreme-Ultraviolet Spectra"
- "Solar Flare Impulsive Phase Emission Observed by SDO/EVE"
