File:Fig3b.png
From RHESSI Wiki
No higher resolution available.
Fig3b.png (666 × 261 pixels, file size: 22 KB, MIME type: image/png)
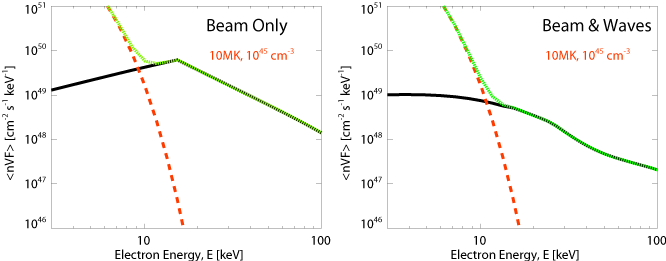
The mean electron flux spectrum <nVF> for the simulation with Coulomb collisions actng on the beam only (left) and the inclusion of wave-particle interaction (right). The black line shows the simulation result, the orange dashed line an overplotted thermal model spectrum. The total spectrum is the dashed green line, indicating the presence of a dip in the Coulomb collision only case.
File history
Click on a date/time to view the file as it appeared at that time.
| Date/Time | Thumbnail | Dimensions | User | Comment | |
|---|---|---|---|---|---|
| current | 14:48, 19 November 2009 | 666×261 (22 KB) | Ihannah (Talk | contribs) | (The mean electron flux spectrum <nVF> for the simulation with Coulomb collisions actng on the beam only (left) and the inclusion of wave-particle interaction (right). The black line shows the simulation result, the orange dashed line an overplotted therma) |
- Edit this file using an external application (See the setup instructions for more information)
File links
The following page links to this file: