Pre-impulsive and Impulsive Phases of the March 28, 2022 Sub-Terahertz Flare
From RHESSI Wiki
| Nugget | |
|---|---|
| Number: | 463 |
| 1st Author: | Galina G. MOTORINA |
| 2nd Author: | |
| Published: | December 11, 2023 |
| Next Nugget: | TBD |
| Previous Nugget: | Coronal Bright Points |
| List all | |
Contents |
Introduction
Rarely, observations show a mysterious emission behavior in the "sub-THz" spectral domain (mm wavelengths). This emission rises to shorter wavelengths, rather than falling as one normally sees even at longer cm wavelengths. What is the origin of this interesting phenomenon? The discovery of this mysterious sub-THz component in the early 2000s received a noticeable attention from solar flare researchers (e.g., Ref. [1]). However, each of proposed mechanisms (models) to explain its occurrence faces certain difficulties.
The problem of the lower atmosphere heating and energy transfer of accelerated particles to the dense layers of the chromosphere/photosphere also remains unresolved. In particular, X-ray sources in the pre-impulsive phase of a flare may be located at the footpoints of coronal loops with temperatures around 10-15 MK. On the other hand, sub-THz emission associated with X-ray emission might be caused by the thermal plasma of the corona, transition region, and chromosphere. This suggests that the study of the sub-THz and X-ray sources can give valuable information about the heating of the chromospheric plasma, which can be produced by accelerated electrons, thermal fluxes, shock waves, and in situ flare energy release.
The present work is devoted to a detailed analysis of the SOL2022-03-28T10:58 (M4.0) solar flare observed first of all with the Bauman Moscow State Technical University Radio Telescope RT-7.5 at 93 GHz. We have now investigated the contribution of the coronal and chromospheric flare plasma heated by accelerated electrons or by coronal thermal fluxes to the generation of the observed sub-THz radiation with a positive spectral slope primarily in the pre-impulsive phase of the solar flare (Ref. [2]).
Observational Data and Processing
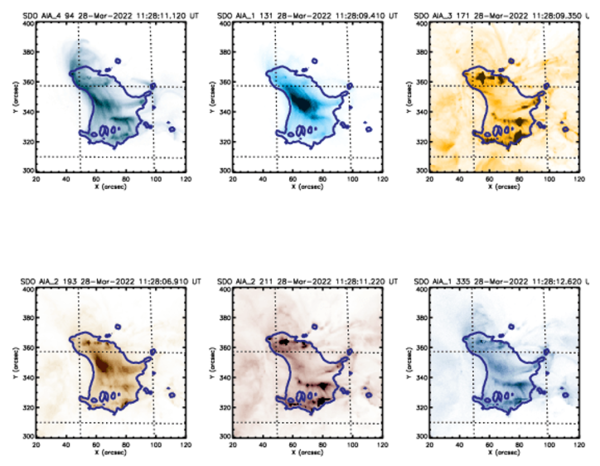
The SOL2022-03-28T105800 flare was observed by several instruments: in EUV (Figure 1), X-ray (Figure 2a, b), microwave, and sub-THz (Figure 2 c, d) ranges. The time profile of sub-THz radiation at 93 GHz (Figure 2d) with a temporal resolution of about 5 min was obtained from maps (e.g., Figure 1e) obtained with the RT-7.5 radio telescope. Figure 2d shows that during the pre-impulsive phase of the flare the spectral flux density of sub-THz radiation was approximately 20 SFU. During the sub-THz maximum at ~11:28 UT the spectral flux density of the flare (Figure 2f) was positive between frequencies of 26 and 93 GHz with a spectral index of 0.6.
We employ SDO/AIA data to infer the differential mission measure (DEM) to quantify the contribution of the spectral flux F from the flare plasma in the temperature range 0.5-32 MK to the observed sub-THz emission. Based on the obtained distributions DEM(T) and the maximum thermal source area S = 7.8x1018 cm3 (Figure 1) we calculate F at 93 GHz in the assumption of thermal bremsstrahlung, which turned out to be equal 1.5 sfu (11:00 UT) and 45 sfu (11:28 UT). These values were noticeably underestimated compared to the observed values of 20±5 sfu and 125±31 sfu, respectively. This means that the coronal plasma contributes only insignificantly to the observed sub-THz flare emission at 93 GHz.
To estimate the contribution of accelerated electrons to the chromospheric heating we fit the X-ray spectra assuming isothermal plasma for the pre-impulsive phase (11:00 UT, Figure 3 left), and isothermal plasma and a thick-target model during the peak of the flare (11:28 UT, Figure 3 right). Within the thick-target the parameters of accelerated electrons were: the spectral index δ = 7.86, the low-energy cut-off E0 = 18.57 keV, and the total integrated electron flux F = 8.57 x 1035 s-1. During the peak the spectrum of accelerated electrons was too soft (spectral index δ = 7.86) to effectively heat the plasma of the transition region and chromosphere.
To estimate the role of coronal thermal fluxes in the heating of chromospheric plasma we calculate the characteristic heating time due to electron thermal conductivity. The obtained estimate (a few tens of hours) excludes the possibility of effective heating of the chromosphere by coronal thermal fluxes during the flare energy release.
Conclusions
We have found that the hot coronal loops observed in the EUV emission make a negligible contribution to the sub-THz flare emission. The main contribution must be from the optically thick layers of the heated chromosphere. On the other hand, the nonthermal electron parameters calculated from the X-ray data indicate a negligible contribution of accelerated electrons to the heating of the chromospheric plasma. This leads to an important conclusion about the existence an additional source of energy release located directly in the Sun's chromosphere. Most likely, heating of the chromosphere occurred as a result of an increasing Joule dissipation of the electric current during the flare.
Acknowledgements
Co-authors Yu.T. Tsap, V.V. Smirnova, A.S. Morgachev, A.D. Shramko, and A.S. Motorin contributed to this work and to Ref. [2].
References
[1] "Solar flares at submillimeter wavelengths"
[2] "Pre-impulsive and Impulsive Phases of the Sub-Terahertz Flare of March 28, 2022"
| RHESSI Nugget Date | 11 December 2023 + |
| RHESSI Nugget First Author | Galina G. MOTORINA + |
| RHESSI Nugget Index | 463 + |


