RHESSI Imaging on Short Timescales
From RHESSI Wiki
Contents |
Introduction
Very little has been done to investigate RHESSI imaging capabilities on short time scales, even as long as the spacecraft rotation period of 4 s. I have begun to investigate this issue by looking at the decay of the 21 April 2002 event during the second orbit after 02:00 UT, when we can safely assume that the morphology of the flare is not changing significantly on such short time scales. Furthermore, the emission is primarily at energies below 20 keV and the source(s) are quite extended so there is little, if any, modulation by the finer grids.
Images in 4-second Time Intervals
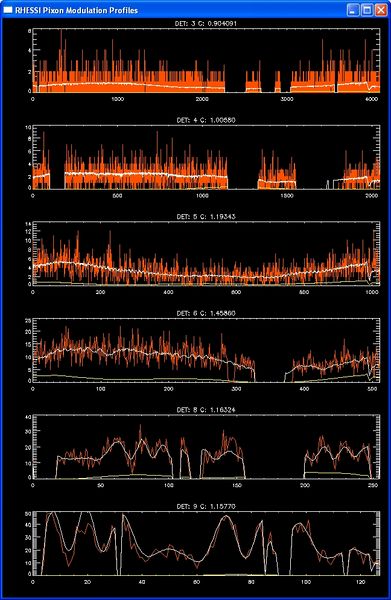
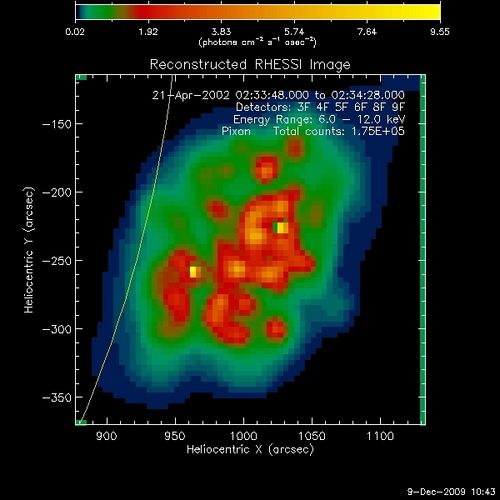
Despite this belief that the source(s) will be extended, the pixon image for a random 4-s interval during this orbit shows several structures.
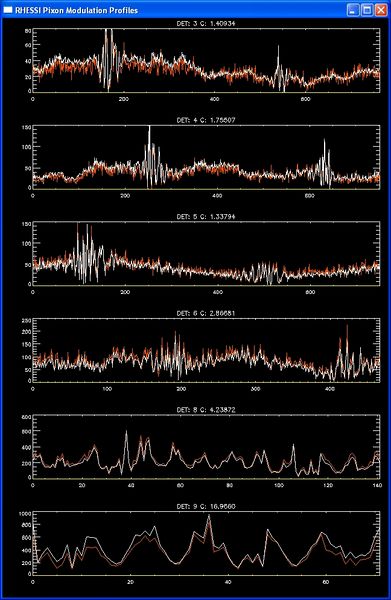
Note that despite the relatively small values of the C-statistic for all detectors, there are considerable differences between the measured count rates and the rates calculated from the image, especially for detector 9.
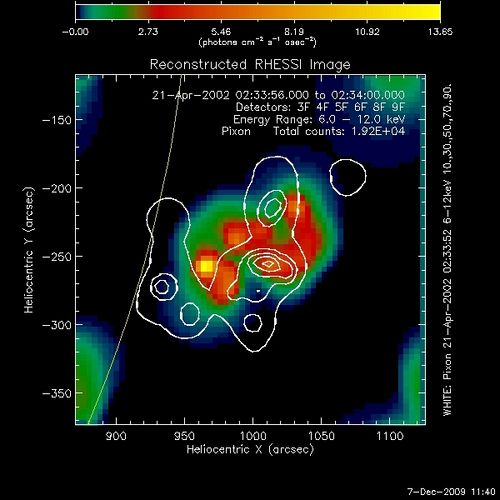
The pixon image for the next 4-s interval looks nothing like the first as shown in the next figure, where this second image is shown in color with the contours showing the first image.
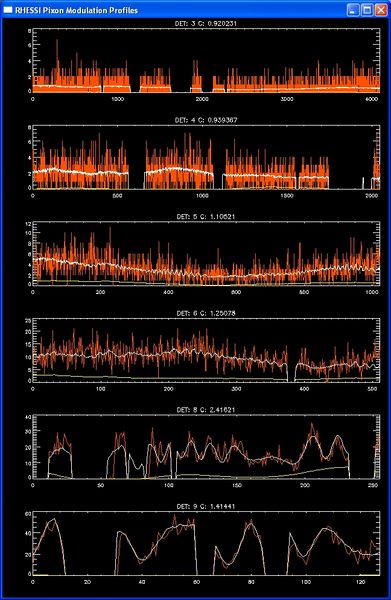
The pixon modulation profiles for this second 4-s interval look similar but note the several large data gaps for detector 8 and 9 and the significantly larger values of the C-statistic, with a value for detector 8 of 2.4. Also note that the predicted profile (the white curve) for detector 8 is shown during a data gap. Richard Schwartz has a fix for this problem by setting the control parameter, NO_CSA_DROPOUT to 1. This uses the absence of counts to identify gaps instead of a Charge Sensitive Amplifier (CSA) reset pulse, which indicates the dissipation of a large amount of charge in the germanium detector and the subsequent electronic saturation leading to a data gap. (Note that the time duration with zero counts to be called a data gap is controlled with the parameters named DP_CUTOFF... )
Source Location vs. Time Every 4 s
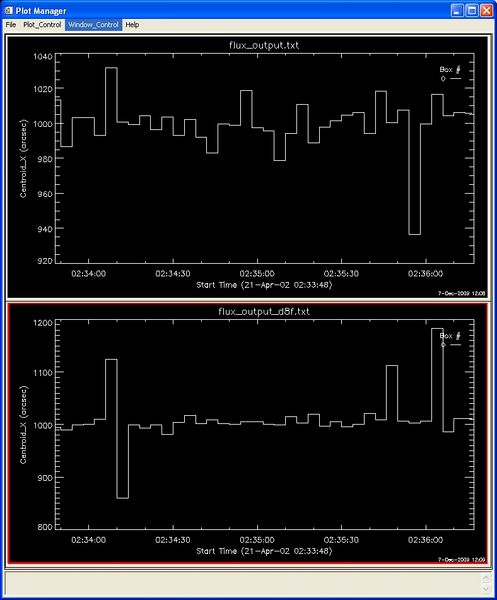
The location of the back-projection source determined for individual grids is shown as a function of time in the next figure. The top plot is for detector 8 and the bottom plot is for detector 9. Note that for most of the time intervals the scatter of the centroid location is of the order of 10 arcseconds but there are a couple of intervals in each case when the centroid is displaced by a much larger amount. It seems that this large displacement is the result of large or multiple data gaps for the individual detectors. Quite why this would result in such large offsets is being investigated.
The 1-sigma statistical error in the source location is given by the following equation taken from Hurford et al. (Apj. 595, L77, 2003):
Insertformulahere
σ = 2RN0.5 / (πaS)
Images in 20-second Time Intervals
But the fine structure in this image is most probably not real either. This can be checked by seeing if any of the features persist in earlier or later images.
Images in 2-s Time Intervals
In principle, RHESSI samples all of the available spatial Fourier components of the image every 2 s. Thus, it should be possible, using the standard image reconstruction techniques to make images on such short time scales where the intensity is high enough to give sufficient number of counts - say >10,000 counts. An example of the fits obtained to the measured countrate light curves for the different detectors is shown in the following figures. The run was stopped after 250 iterations. Note that chi-squared for detector #9 had already begun to rise after about 140 iterations whereas the chi-squared values for detectors 7 and 8 only bagan to rise after iteration 200. This suggests that the response of detector 9 relative to detectors 7 and 8 is incorrect.
Figure 9:' Plot obtained with chi-squared test enabled in the CLEAN image reconstruction algorithm with the gain set to 0.1. Chi-squared values and countrate profiles are shown for the 4-s interval from 02:10:04 to 02:10:08 UT on 21 April 2002. The chi-squared values are plotted vs iteration number and the count rates are plotted vs. time for the 4-s interval. |

