Sun-as-a-star spectroscopic observations of the line-of-sight velocity of a solar eruption on October 28, 2021
From RHESSI Wiki
| Nugget | |
|---|---|
| Number: | 430 |
| 1st Author: | Yu XU |
| 2nd Author: | Hui TIAN |
| Published: | 30 May 2022 |
| Next Nugget: | TBD |
| Previous Nugget: | Carl Størmer |
| List all | |
Contents |
Introduction
Solar coronal mass ejections (CMEs) are the main drivers of space weather. The propagation direction and true velocity are among the most decisive factors that affect the geoeffectiveness of a CME, and thus their accurate determination is of great importance. With single-spacecraft observations, we may achieve this goal by combining measurements of the plane-of-sky (POS) and line-of-sight (LOS) velocity components. However, the latter is generally very difficult due to the limited field-of-view (FOV) of almost all slit spectrometers (e.g., Ref. [1)).
This Nugget shows that a low-cost Sun-as-a-star spectrograph able to measure full-disk integrated EUV spectra may allow us to overcome this difficulty (Ref. [2]).
Observation
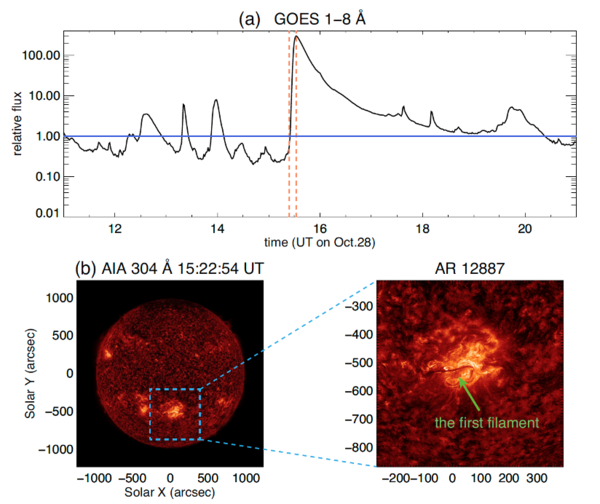
A mass ejection associated with the flare SOL2021-10-28T15:35 (GOES class X1.0) occurred in AR 12887, SOL2021-10-28T15:32 located near the central meridian in the southern hemisphere of the Sun (Figure 1). A filament in this region rose in height, likely with heating, and this led to the mass ejection. This was well observed by many observatories at or near Earth. In the meantime, STEREO-A/EUVI captured the eruption while at a position around 37°.5 east of the Sun-Earth line.

Results
Blue-shifted secondary components caused by the outward motion of the mass ejection were found in line profiles in the full-disk integrated spectra observed by SDO/EVE (Figure 2). The line-of-sight velocity, via the Doppler shift was estimated using both double Gaussian fits and a red-blue asymmetry analysis method.

The true velocity of the bulk motion of the ejecta was determined by combining the plane-of-sky velocity obtained from the imaging observation of STEREO-A/EUVI with the line-of-sight velocity derived from the EVE spectra. This determines a full velocity vector, which turns out to have an amplitude of about 596 km/s with an angle of 42°.4 relative to the west of the SunEarth line and 16°.0 south relative to the ecliptic plane (Figure 3).

Another interesting feature we found is that coronal dimming signatures are clearly present in transition-region lines such as O V 62.96 nm and O VI 103.1 nm in this CME event, suggesting that significant amounts of plasma in the lower atmosphere were ejected
Summary
We have identified distinct velocity components in a coronal mass ejection by finding blue-wing featuress in several emission lines in the Sun-as-a-star spectra observed by SDO/EVE. This finding suggests that full-disk integrated EUV spectra, combined with imaging observations, have the potential to describe the full vector velocities of CMEs (see also the analytical model in Ref. [3])), and thus could be used to improve the prediction accuracy of the geoeffectiveness of CMEs. It also suggests that we may detect stellar CMEs through high-resolution spectroscopy, even though we cannot spatially resolve these features.