Weekly Report 8Oct2010
From RHESSI Wiki
Contents |
Pixon Images of the Albedo
I looked into the issue of the C statistic increasing as a function of the total counts for Pixon images of Eduard Kontar's simulated data. As the total counts in each detector increases the C statistic in each detector also rises. I obtained Eduard's script used to create the simulated data eventlists from the original data map. I used the script to create several eventlist files with different numbers of total counts. This was done for the data map near disk center in order to minimize any problems caused by the possible inability of Pixon to image the foreshortening of the albedo. The results showed that there is a steady increase in the C statistic for each detector. The slope of the increase is larger in the detectors with the coarser grids. Counts were added to the images such that the the total counts increase everywhere in the original map. Is the C statistic increasing because the non-gaussian extended source is becoming stronger and Pixon cannot image it correctly?
New RHESSI Website Progress
A meeting was organized to discuss the current state of the new RHESSI Website and the future direction of the effort to move content to the new format. It was decided that we would continue creating the structure of the website while linking to external documents for the final content. Some of this content will be moved into the Content Management System, Typo3, which we are currently using, if the documents are in a more or less permanent state. For documents that change frequently, especially if updates to the content is produced automatically, we will keep them outside the CMS, and continue simply linking to them. Cosmetic changes to the site were also discussed. I will proceed with the implementation of these next week.
I should be finished with writing a simplified version of a guide to adding content to new site. Currently there is document available at the link below which gives details of editing content using typo3 along with screenshots: Editing the New RHESSI Site using Typo3
Testing Image Reconstruction Algorithms
I've started running tests of the Clean image algorithm using the simulated data agreed upon at the RHESSI Workshop. I've started with the first image, a line source, as the test case. For the case of the line source, the following clean image, shown below as contours on the original data map, was obtained.
This Clean image was obtained with a clean_beam_width_factor = 2.0.
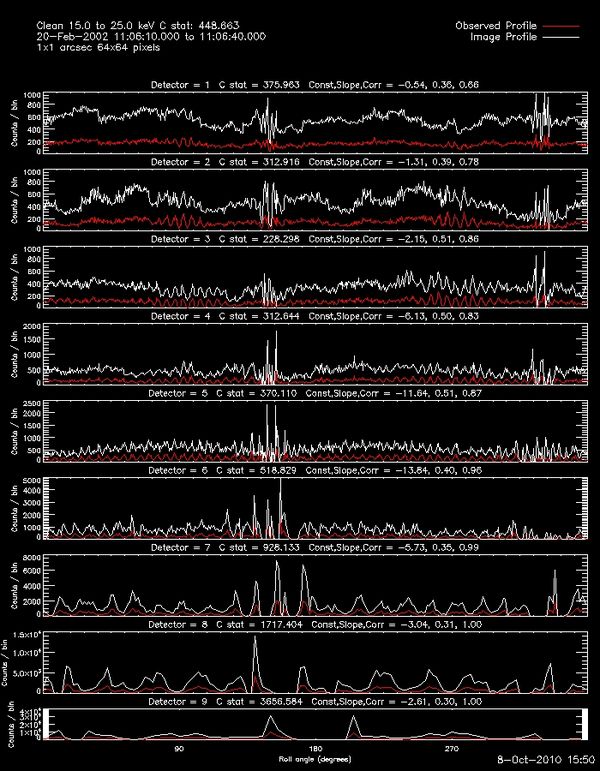
The following profiles were obtained with this image:
As is clear from the above profiles, either the calibrations of the detectors is incorrect or the Clean Image and profiles are not correlated. Looking at the image compared to the original data map it dose not seem that the profiles for each detector should be so far off.
A script was provided by Richard Schwartz to calculate the statistical differences between the simulated images and the reconstructed images. Using Richard's routine to obtain the total C statistic yields a value of:
Total C Statistic = 6.37
While this value is not acceptable it is considerably smaller than the value I get from the C statistics using hsi_plot_image_profile. Going through Richard's script for calculating the C statistic, he does it in a different manner than the C statistic is calculated in the HESSI GUI. One, or both methods, is getting this very wrong. I think that the current C statistic implementation in HESSI is correct because wee have used it extensively. There is either a problem with the simulated data or the script being used to create the reconstructed image.
Goals for next week
- Finish the document for users wishing to add content to the new RHESSSI site
- Fix the script used to create reconstructed images from simulated data for the image algorithm tests agreed to at the RHESSI workshop. I'm sure Richard tested this script so I think the problem is with my implementation
- Discuss with Brian the issue of the increasing C statistics, this needs some explanation, but I'm running out of ideas.
- Continue migrating content to the new RHESSI Site

