Weekly Report 20Aug2010
From RHESSI Wiki
Contents |
Visibility Forward Fit reduced chi2 and C statistics
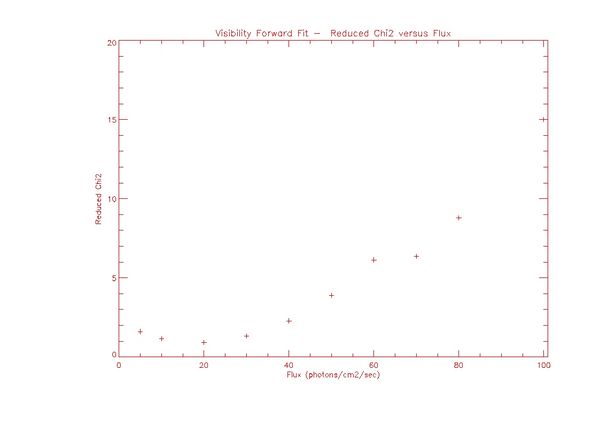
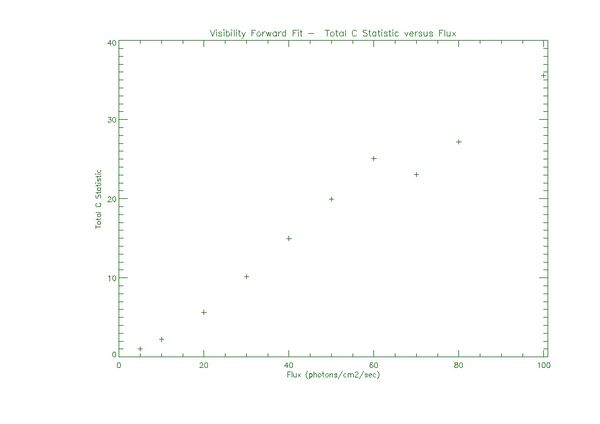
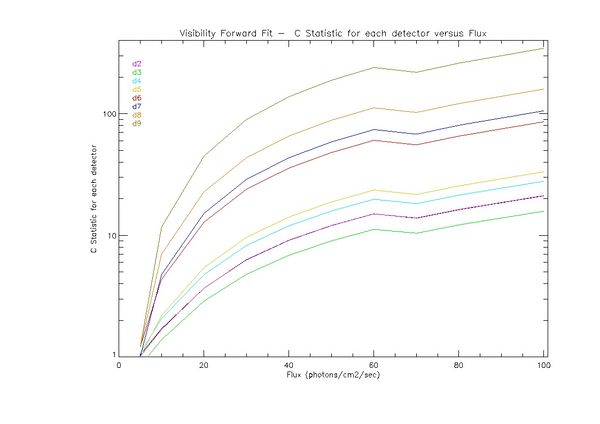
In the following cases the visibility forward fit algorithm was used to make an image of a simulated point source at the center of the disk. The images were created allowing only a single iteration of the image fitting algorithm. This was done to check the effect on the reduced chi squared and C statistics of the image of varying either the full width half max of the source with all other parameters held constant or changing the flux of the image with all other parameters held constant. In both cases the initial guess for the source was a circular gaussian.
Visibility Forward Fit- reduced chi2 and C statistics when changing the FWHM of the circular source
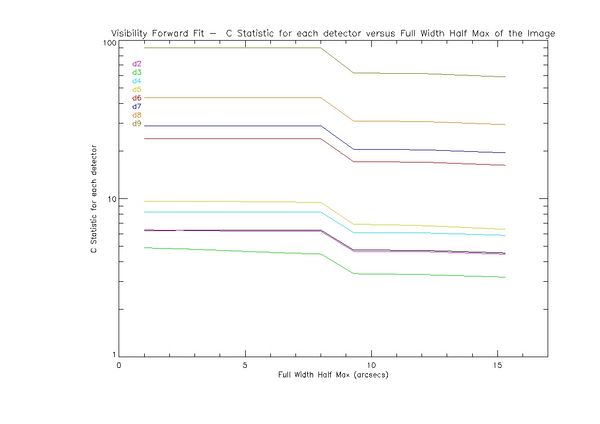
In this case all parameters of the circular gaussian image were started at the values obtained by allowing the algorithm to iterate until it reached it's lowest reduced chi2 value. This was taken to be the best image the algorithm could create using a single circular gaussian source. All parameters except for the full width half max (FWHM) were started at these values. The FWHM was then systematically varied. The algorithm was allowed to do one iteration (see issues with visibility forward fit for an explanation of this)and the reduced chi2, the total C statistic, and the the C statistic for each detector were calculated.
The plot below shows the reduced chi2 as a function of the FWHM of the final image.
The reduced chi2 is varies between a low of approximately 1.3 and a high of 1.6. The lowest point of the distribution is around a FWHM value of 2.5 arcsecs. The actual FWHM of the original image map is approximately 2 arcsecs so this seems to be a promising result. However at no point does the reduced chi2 reach the value of 0.87 achieved by allowing the algorithm to iterate.
The plot below shows the total C statistic of all detectors combined versus the final FWHM of the image


