File:179fig1.png
From RHESSI Wiki

Size of this preview: 800 × 400 pixels
Full resolution (1,889 × 945 pixels, file size: 42 KB, MIME type: image/png)
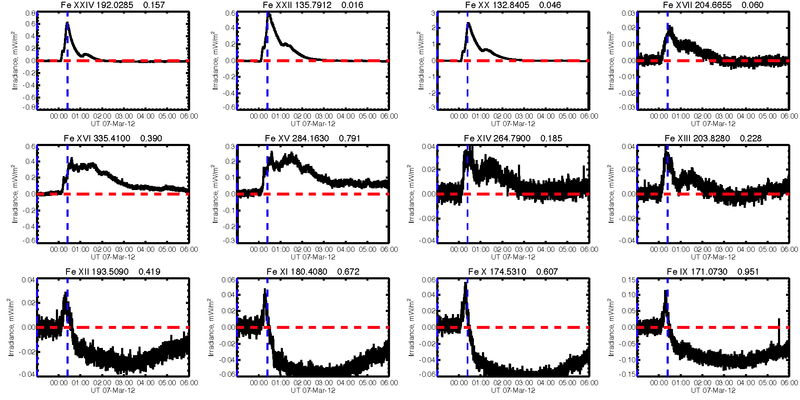
Figure 1: An "Fe cascade" plot showing the time variations of various ionization states of iron, from Fe XXIV (Fe+23) in the upper left, to Fe IX (Fe+7) in the lower right. These represent different temperatures; the high-temperature stages show emission from coronal loops during the flare, and the low-temperature stages show the dimming resulting from the evacuation of the corona by the CME associated with the flare SOL2012-03-07.
File history
Click on a date/time to view the file as it appeared at that time.
| Date/Time | Thumbnail | Dimensions | User | Comment | |
|---|---|---|---|---|---|
| current | 07:27, 24 June 2012 |  | 1,889×945 (42 KB) | Hhudson (Talk | contribs) | (Figure 1: An "Fe cascade" plot showing the time variations of various ionization states of iron, from Fe XXIV (Fe<sup>+23</sup>) in the upper left, to Fe IX (Fe<sup>+7</sup>) in the lower right. These represent different temperatures; the high-temperatu) |
- Edit this file using an external application (See the setup instructions for more information)
File links
The following page links to this file: