File:25F3.png
From RHESSI Wiki

Size of this preview: 800 × 359 pixels
Full resolution (941 × 422 pixels, file size: 68 KB, MIME type: image/png)
Mean electron spectra distributions versus energy in keV. Left plot for the initial energy flux F of &10^{10} erg/cm^2/s; right plot for F=&10^{12} erg/cm^2 /s.spectral indices &delta: 3 (dot-dashed lines), 5 (dashed lines), and 7 (solid lines).
File history
Click on a date/time to view the file as it appeared at that time.
| Date/Time | Thumbnail | Dimensions | User | Comment | |
|---|---|---|---|---|---|
| current | 21:44, 21 March 2021 | | 941×422 (68 KB) | ValentinaZharkova (Talk | contribs) | (Mean electron spectra distributions versus energy in keV. Left plot for the initial energy flux F of &10^{10} erg/cm^2/s; right plot for F=&10^{12} erg/cm^2 /s; spectral indices &delta: 3 (dot-dashed lines), 5 (dashed lines), and 7 (solid lines).) |
| 21:42, 21 March 2021 | 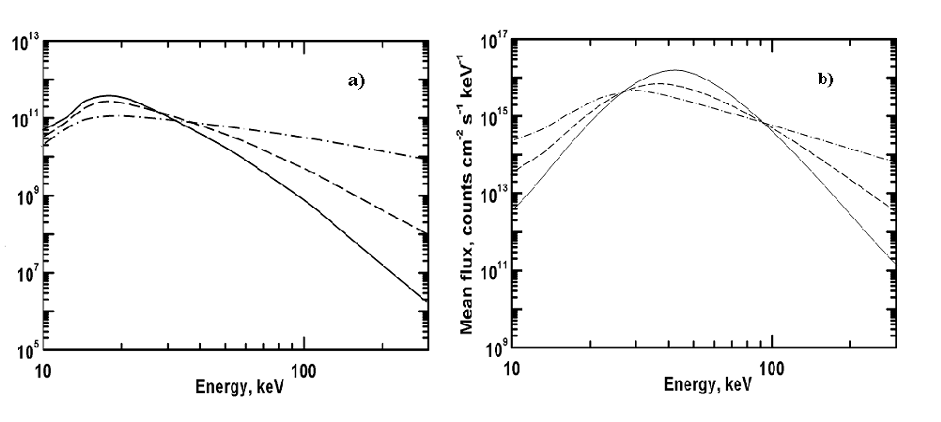 | 941×422 (68 KB) | ValentinaZharkova (Talk | contribs) | (Mean electron spectra distributions versus energy in keV. Left plot for the initial energy flux F of &10^{10} erg/cm^2/s; right plot for F=&10^{12} erg/cm^2 /s.spectral indices &delta: 3 (dot-dashed lines), 5 (dashed lines), and 7 (solid lines).) |
- Edit this file using an external application (See the setup instructions for more information)
File links
The following 2 files are duplicates of this file (more details):
There are no pages that link to this file.