Weekly Report 18Feb2011 25Feb2011
From RHESSI Wiki
(Difference between revisions)
(→MESSENGER Data Analysis Project) |
|||
| Line 9: | Line 9: | ||
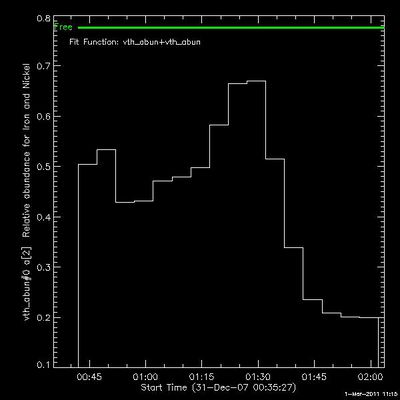
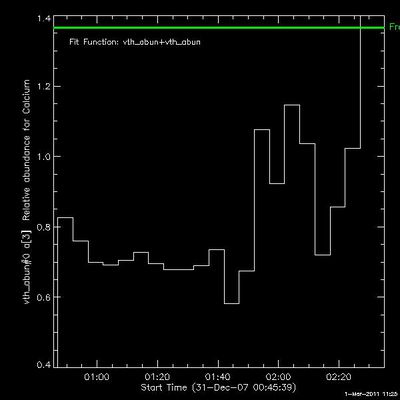
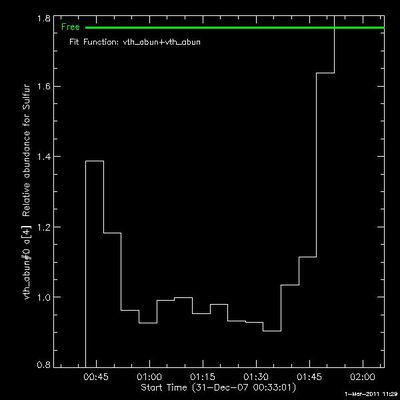
Time series analysis was done on the 31Dec2007 flare using MESSENGER XRS data. Abundances were measured for various elements over the course of the flare. | Time series analysis was done on the 31Dec2007 flare using MESSENGER XRS data. Abundances were measured for various elements over the course of the flare. | ||
| - | [[File:Fe ni abundance.jpg|center|thumb| | + | [[File:Fe ni abundance.jpg|center|thumb|400px|]] |
| - | [[File:Ca abundance.jpg|center|thumb| | + | [[File:Ca abundance.jpg|center|thumb|400px|]] |
| - | [[File:Su abundance.jpg |center|thumb| | + | [[File:Su abundance.jpg |center|thumb|400px|]] |
===RHESSI Pixon Albedo Imaging Test=== | ===RHESSI Pixon Albedo Imaging Test=== | ||
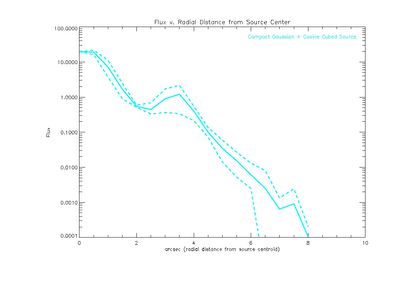
Calibrated eventlist files were created from maps consisting of a compact Gaussian source and an extended cosine cubed source. The total flux of the cosine cubed source was adjusted to different percentages of the total flux of the compact Gaussian source. Pixon and Clean images were made from each eventlist file. Using these images, plots were made of the flux as a function of the radial distance from the peak of the Gaussian source. | Calibrated eventlist files were created from maps consisting of a compact Gaussian source and an extended cosine cubed source. The total flux of the cosine cubed source was adjusted to different percentages of the total flux of the compact Gaussian source. Pixon and Clean images were made from each eventlist file. Using these images, plots were made of the flux as a function of the radial distance from the peak of the Gaussian source. | ||
| + | |||
| + | [[File:Gaussian source cosine cubed.jpg|center|thumb|400px|]] | ||
Revision as of 19:38, 1 March 2011
RHESSI Website Migration
The RHESSI Website Migration Project continued.
- Work was done on formatting issues including indentation issues and updating the appearance of links (symbols were added to differentiate external links from internal links).
- Mount points with paths relative to the typo3 installation were added as additional places to upload files and media. I'm still working on adding the mount point for files are outside the path of the typo3 installation.
MESSENGER Data Analysis Project
Time series analysis was done on the 31Dec2007 flare using MESSENGER XRS data. Abundances were measured for various elements over the course of the flare.
RHESSI Pixon Albedo Imaging Test
Calibrated eventlist files were created from maps consisting of a compact Gaussian source and an extended cosine cubed source. The total flux of the cosine cubed source was adjusted to different percentages of the total flux of the compact Gaussian source. Pixon and Clean images were made from each eventlist file. Using these images, plots were made of the flux as a function of the radial distance from the peak of the Gaussian source.


