File:199f2.png
From RHESSI Wiki
(Difference between revisions)
(Four panels showing three spectrograms and one time series of RHESSI counts, all preliminary views. Upper left shows a long time series at 25 ms resolution, 10 keV - 10 MeV. Upper right and lower left show similar spectrograms over an 0.2 s interval, wit) |
(uploaded a new version of "File:199f2.png": A weaker burst in the late phase, observed only at lower energies.) |
Latest revision as of 15:53, 6 May 2013
Four panels showing three spectrograms and one time series of RHESSI counts, all preliminary views. Upper left shows a long time series at 25 ms resolution, 10 keV - 10 MeV. Upper right and lower left show similar spectrograms over an 0.2 s interval, with 1 ms binning; upper right is the same spectral range, while lower left shows off the 1 - 10 MeV range. The timeseries plot at lower right shows the temporal relationships a bit more quantitatively.
File history
Click on a date/time to view the file as it appeared at that time.
| Date/Time | Thumbnail | Dimensions | User | Comment | |
|---|---|---|---|---|---|
| current | 15:53, 6 May 2013 | 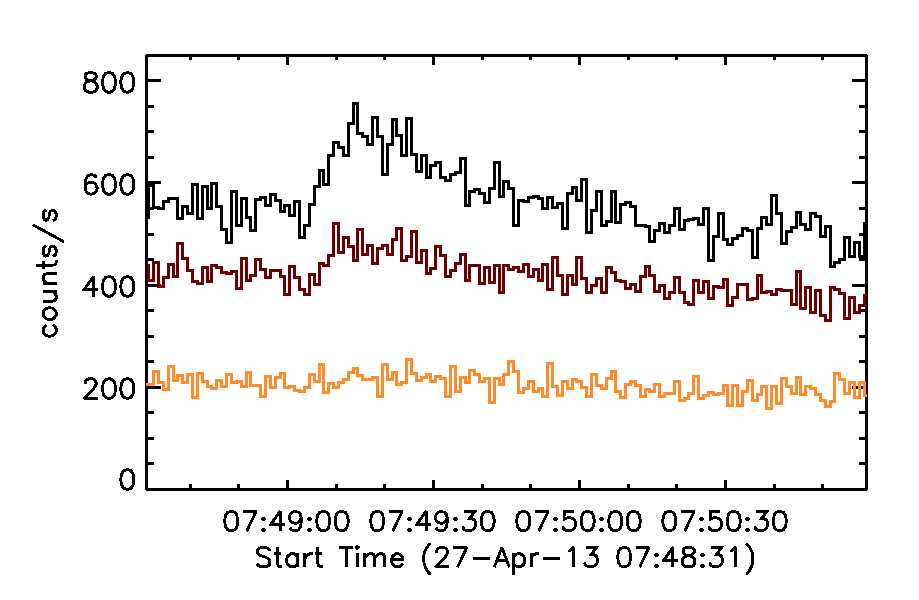 | 919×600 (14 KB) | Hhudson (Talk | contribs) | (A weaker burst in the late phase, observed only at lower energies.) |
| 16:43, 1 May 2013 | 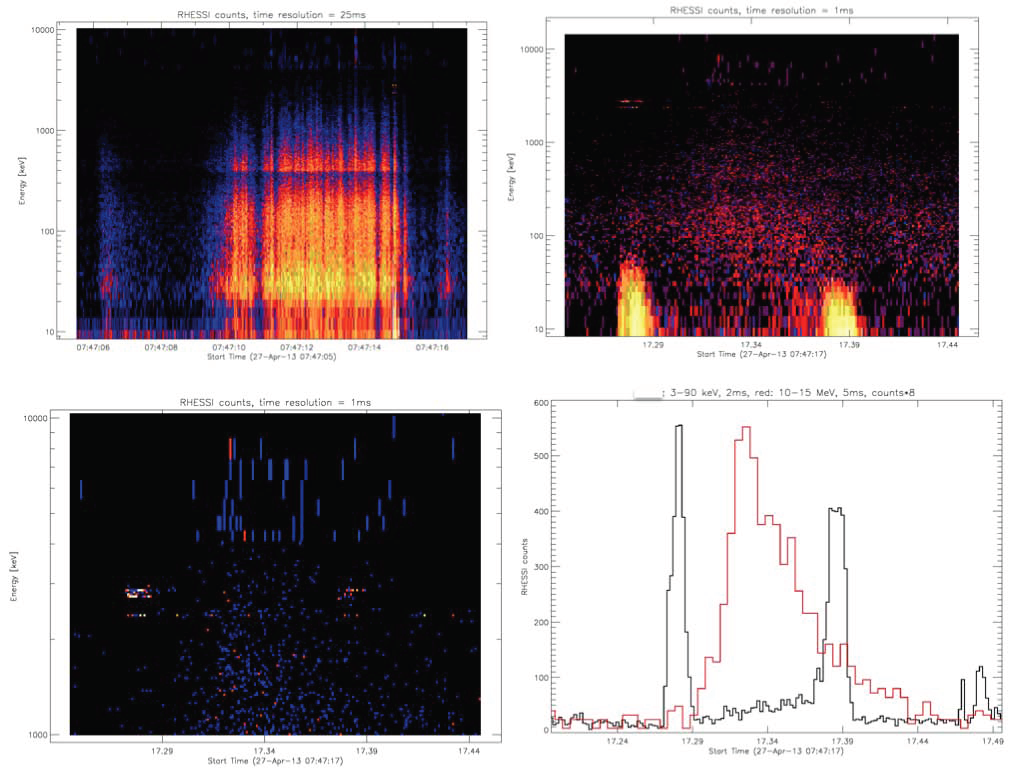 | 1,014×777 (566 KB) | Hhudson (Talk | contribs) | (Four panels showing three spectrograms and one time series of RHESSI counts, all preliminary views. Upper left shows a long time series at 25 ms resolution, 10 keV - 10 MeV. Upper right and lower left show similar spectrograms over an 0.2 s interval, wit) |
- Edit this file using an external application (See the setup instructions for more information)
File links
The following file is a duplicate of this file (more details):
There are no pages that link to this file.