File:Hxr motion.png
From RHESSI Wiki
(uploaded a new version of "Image:Hxr motion.png": TRACE 171 Å image overlaid with centroid positions of the HXR looptop emission (in a '+' symbol) and of the HXR footpoints (in a 'x' symbol). The time evolution of the centroid positions is color) |
|||
| Line 1: | Line 1: | ||
| - | TRACE 171 Å image | + | [http://en.wikipedia.org/wiki/TRACE TRACE] 171 Å image prior to a GOES C8.9 flare, overlaid with centroid positions of the hard X-ray (HXR) looptop emission (in a '+' symbol) and of the HXR footpoints (in a 'x' symbol), observed by RHESSI during the flare. The time evolution of the centroid positions is color-coded, and the positions are differentially rotated to 2005 July 30 16:40:34 UT, the time when the TRACE image was taken. A collection of coronal loops, which first contracted, then expanded, and erupted during the flare, is labeled 'L'. A filament appearing in absorption is labeled 'F', which erupted with the coronal loops during their expansion phase. A horizontal slit is placed across the group of coronal loops to study their contraction. |
Revision as of 15:17, 10 February 2009
TRACE 171 Å image prior to a GOES C8.9 flare, overlaid with centroid positions of the hard X-ray (HXR) looptop emission (in a '+' symbol) and of the HXR footpoints (in a 'x' symbol), observed by RHESSI during the flare. The time evolution of the centroid positions is color-coded, and the positions are differentially rotated to 2005 July 30 16:40:34 UT, the time when the TRACE image was taken. A collection of coronal loops, which first contracted, then expanded, and erupted during the flare, is labeled 'L'. A filament appearing in absorption is labeled 'F', which erupted with the coronal loops during their expansion phase. A horizontal slit is placed across the group of coronal loops to study their contraction.
File history
Click on a date/time to view the file as it appeared at that time.
| Date/Time | Thumbnail | Dimensions | User | Comment | |
|---|---|---|---|---|---|
| current | 15:03, 10 February 2009 |  | 554×489 (214 KB) | Rliu (Talk | contribs) | (TRACE 171 Å image overlaid with centroid positions of the HXR looptop emission (in a '+' symbol) and of the HXR footpoints (in a 'x' symbol). The time evolution of the centroid positions is color-coded, and the positions are differentially rotated t) |
| 14:56, 10 February 2009 | 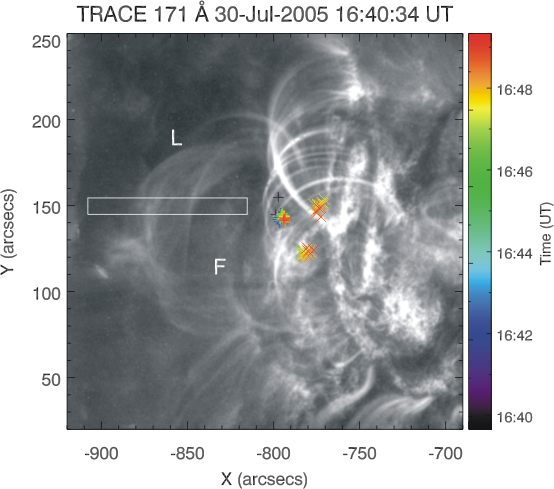 | 554×489 (214 KB) | Rliu (Talk | contribs) | (TRACE 171 Å image overlaied with centroid positions of the HXR looptop emission (in a '+' symbol) and of the HXR footpoints (in a 'x' symbol). The time evolution of the centroid positions are color-coded, and are differentially rotated to 16:40:34 U) |
- Edit this file using an external application (See the setup instructions for more information)
File links
The following page links to this file: