Weekly Report 12Nov2010
From RHESSI Wiki
(Difference between revisions)
(→RHESSI Imaging Algorithm Test - Clean) |
|||
| Line 1: | Line 1: | ||
===Pixon Albedo Imaging Results=== | ===Pixon Albedo Imaging Results=== | ||
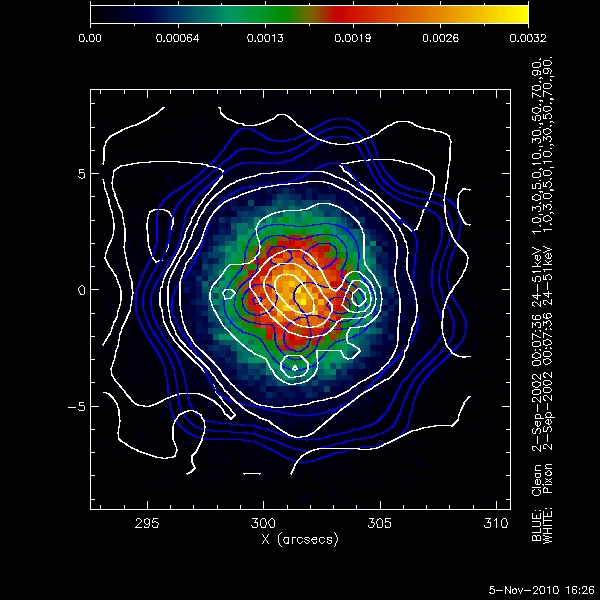
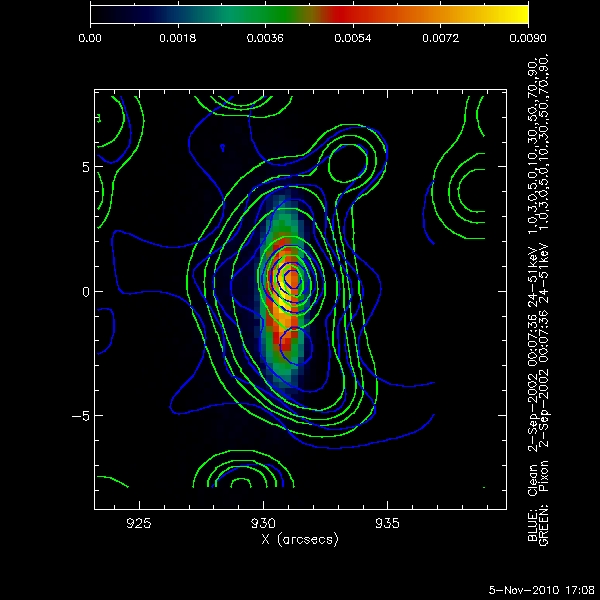
| - | Using Eduard Kontar's simulated eventlist files, Pixon Images were created for a compact circular gaussian source with an albedo near disk center, and near the limb. | + | Using Eduard Kontar's simulated eventlist files, Pixon Images were created for a compact circular gaussian source with an albedo near disk center, and near the limb. The following parameters were used for each image: |
| + | |||
| + | *Time: 2-Sep-2002 00:07:36 - 00:08:16 | ||
| + | *Energy 24keV - 51keV | ||
| + | *Detectors 1 t0 4 | ||
| + | *Image Size: 64 by 64 pixels | ||
| + | *Pixel Size: .5 arcsec by .5 arcsec | ||
| + | |||
| + | In each Image below the following convention was used: | ||
| + | |||
| + | *Background Image: The original data map supplied by Eduard Kontar | ||
| + | *Blue Contours: The Clean Image Contours | ||
| + | *White Contours: The Pixon Image Contours | ||
| + | |||
| + | The Contours levels used were: 1%, 3%, 5%, 10%, 30%, 50%, 70%, and 90% of the total flux in the image. | ||
| + | |||
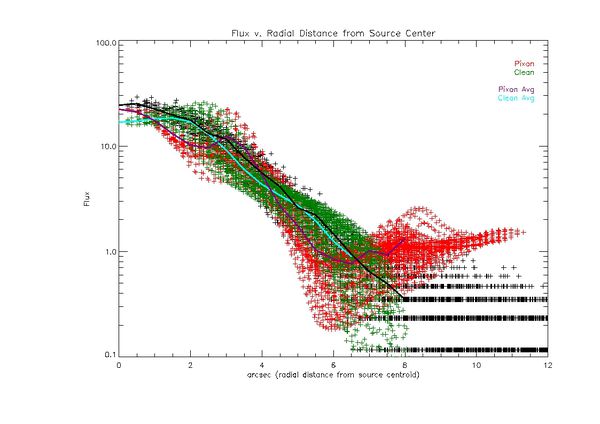
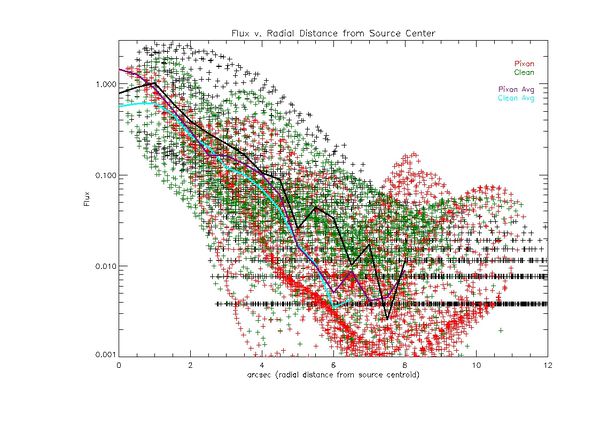
| + | The plots below each image show the flux of a pixel as a function of the distance from the centroid of the source. It is a modification of looking at the flux along a single line through the image. In this method every pixel is plotted so the entire image can be viewed. The following conventions were used in all radial profile plots: | ||
| + | |||
| + | * The values of the flux for the original data map were 'normalized' such that the peak value matches the peak value of the Pixon images | ||
| + | * The flux values for each pixel in the original data map are black points | ||
| + | * The flux values for each pixel in the Pixon image are red points | ||
| + | * The flux values for each pixel in the Clean image are green points | ||
| + | * The average value of the flux at each radial distance in the original data map is represented by the solid black line | ||
| + | * The average value of the flux at each radial distance for the Pixon image is represented by the purple line | ||
| + | * The average value of the flux at each radial distance for the Clean image is represented by the cyan line | ||
====Simulated source closer to disc center(X = 301 arcsec, Y= 0 arcsec)==== | ====Simulated source closer to disc center(X = 301 arcsec, Y= 0 arcsec)==== | ||
Revision as of 00:50, 16 November 2010
Contents |
Pixon Albedo Imaging Results
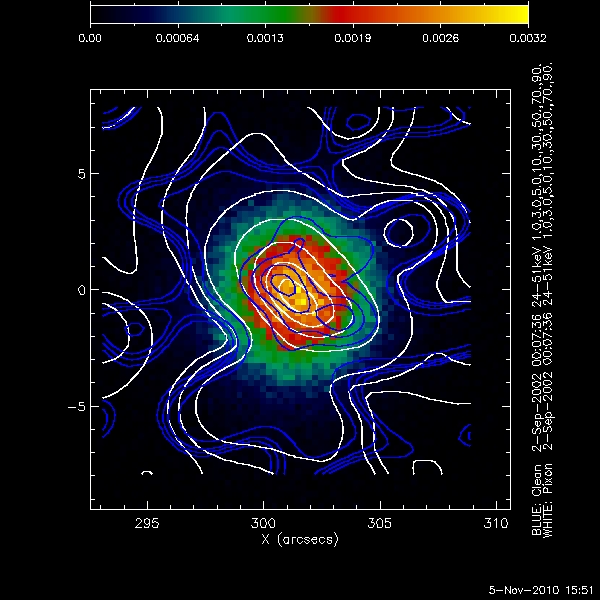
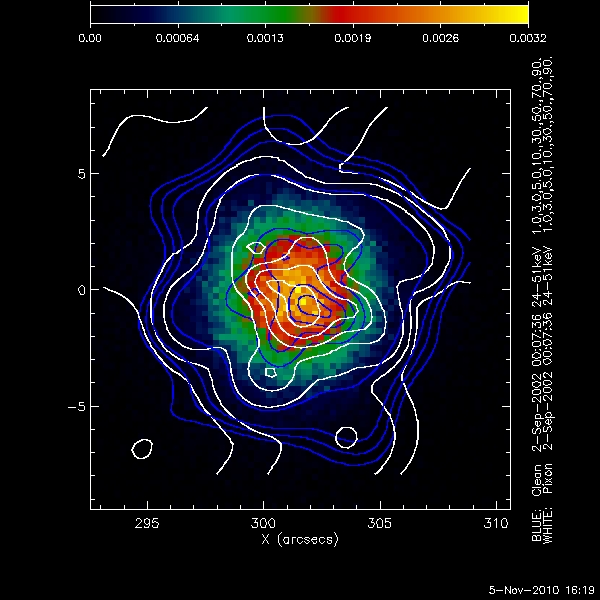
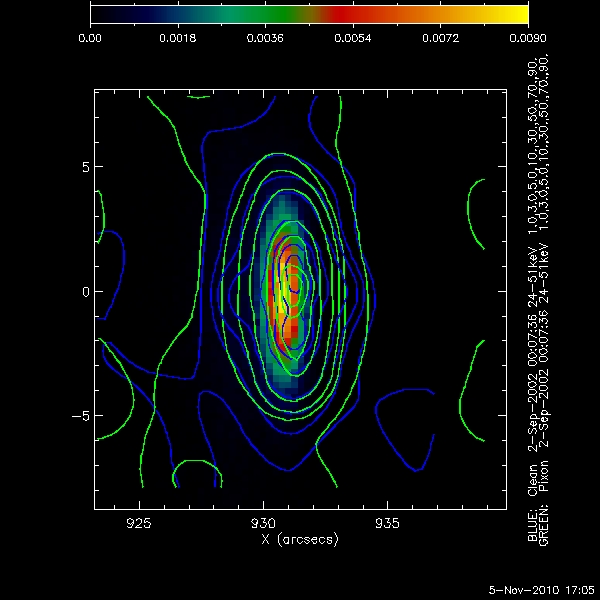
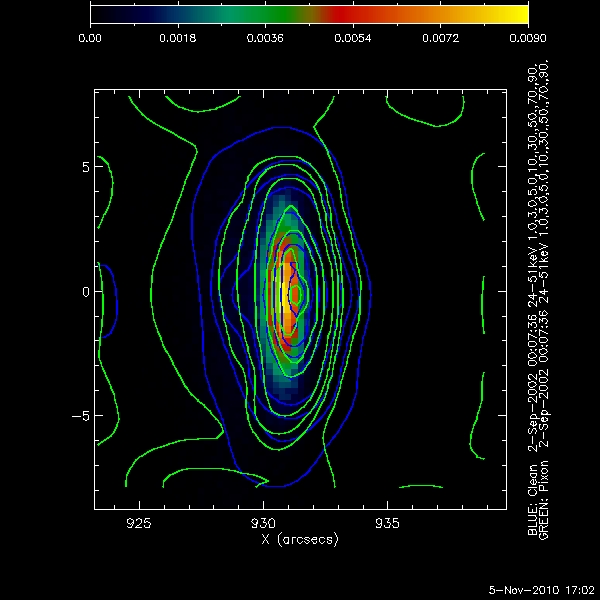
Using Eduard Kontar's simulated eventlist files, Pixon Images were created for a compact circular gaussian source with an albedo near disk center, and near the limb. The following parameters were used for each image:
- Time: 2-Sep-2002 00:07:36 - 00:08:16
- Energy 24keV - 51keV
- Detectors 1 t0 4
- Image Size: 64 by 64 pixels
- Pixel Size: .5 arcsec by .5 arcsec
In each Image below the following convention was used:
- Background Image: The original data map supplied by Eduard Kontar
- Blue Contours: The Clean Image Contours
- White Contours: The Pixon Image Contours
The Contours levels used were: 1%, 3%, 5%, 10%, 30%, 50%, 70%, and 90% of the total flux in the image.
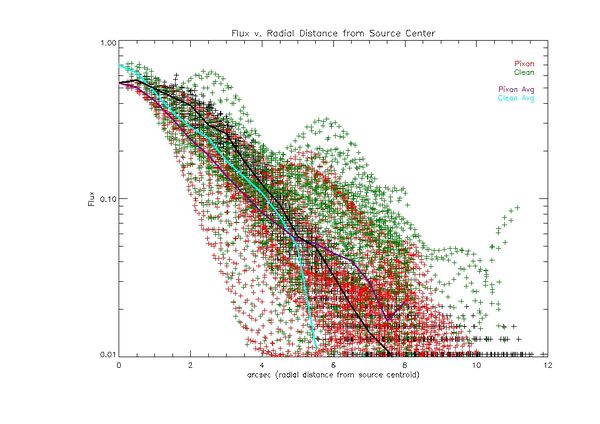
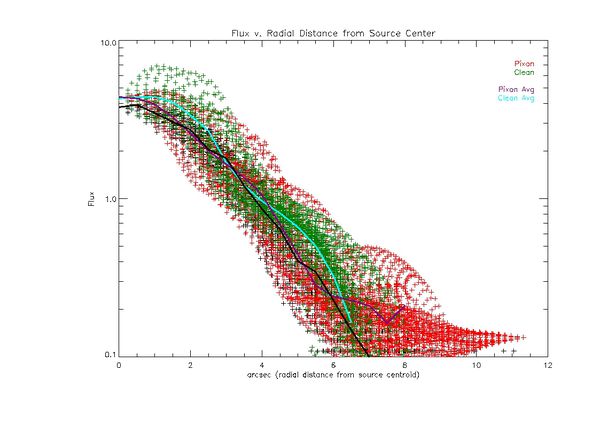
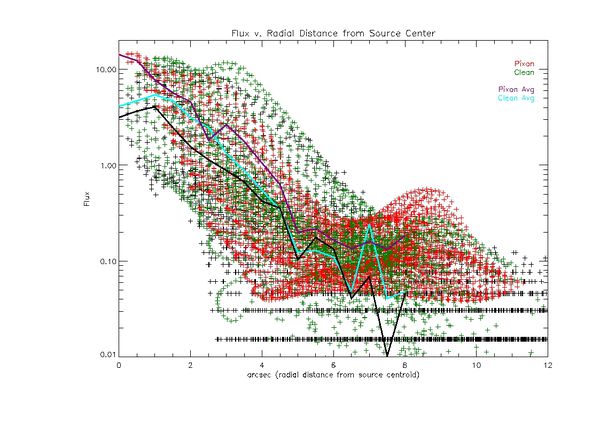
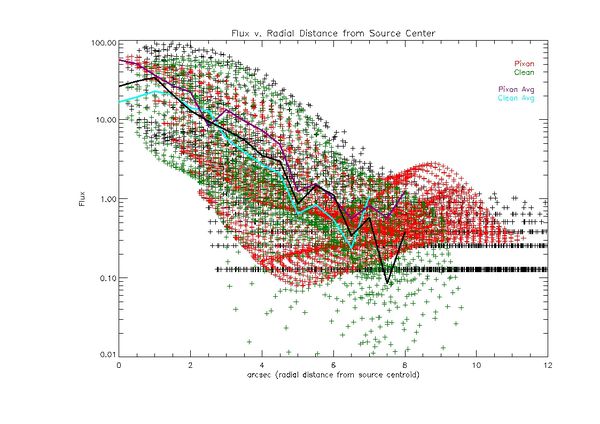
The plots below each image show the flux of a pixel as a function of the distance from the centroid of the source. It is a modification of looking at the flux along a single line through the image. In this method every pixel is plotted so the entire image can be viewed. The following conventions were used in all radial profile plots:
- The values of the flux for the original data map were 'normalized' such that the peak value matches the peak value of the Pixon images
- The flux values for each pixel in the original data map are black points
- The flux values for each pixel in the Pixon image are red points
- The flux values for each pixel in the Clean image are green points
- The average value of the flux at each radial distance in the original data map is represented by the solid black line
- The average value of the flux at each radial distance for the Pixon image is represented by the purple line
- The average value of the flux at each radial distance for the Clean image is represented by the cyan line
Simulated source closer to disc center(X = 301 arcsec, Y= 0 arcsec)
Simulated source near the limb (X = 930 arcsec, Y = 0 arcsec)
