An Fe Cascade
From RHESSI Wiki
(171) |
|||
| Line 47: | Line 47: | ||
may fully ionize Fe (depending on the flare). | may fully ionize Fe (depending on the flare). | ||
| - | [[File:171fig1.png| | + | [[File:171fig1.png|thumb|center|400px|Figure 1: An example of an Hα loop prominence system seen at the limb of the Sun. |
Generally it is not clear why these loops, with obviously different geometry, | Generally it is not clear why these loops, with obviously different geometry, | ||
have cooled so simultaneously.]] | have cooled so simultaneously.]] | ||
| Line 69: | Line 69: | ||
fairly clearly: the less-ionized states peak later than the more-ionized states. | fairly clearly: the less-ionized states peak later than the more-ionized states. | ||
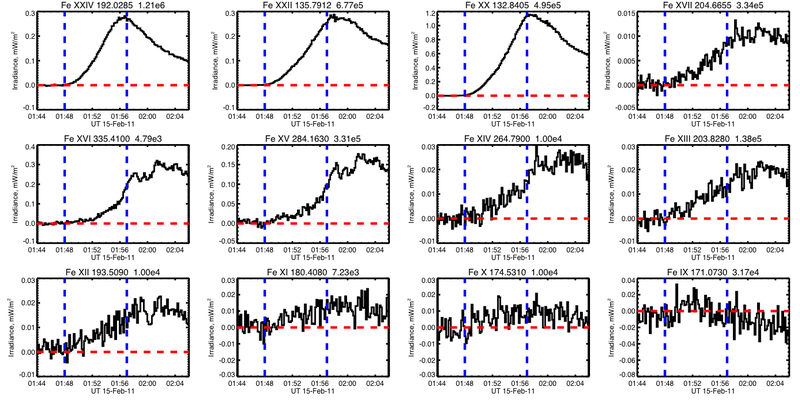
| - | [[File:171fig2.png| | + | [[File:171fig2.png|800px|Figure 2: Fe cascade plots for a short time |
interval around flare maximum. Note that all of the EUV signals, which | interval around flare maximum. Note that all of the EUV signals, which | ||
show the post-flare loops, follow the RHESSI impulsive phase (blue lines) | show the post-flare loops, follow the RHESSI impulsive phase (blue lines) | ||
Revision as of 01:07, 14 March 2012
| Nugget | |
|---|---|
| Number: | 171 |
| 1st Author: | Hugh Hudson |
| 2nd Author: | |
| Published: | 12 March 2012 |
| Next Nugget: | TBD |
| Previous Nugget: | [1] |
| List all | |
Contents |
Iron in the solar corona
It seems sometimes as though the solar corona might be made entirely of iron, since its ions yield so many EUV and X-ray emission lines - a remark possibly first made by Werner Neupert. In reality, of course, the corona mostly consists of hydrogen, which therefore dominates the dynamics, and the iron is perhaps just there to be helpful diagnostically. In any case the high Z of iron gives us an opportunity to observe many states of ionization; in the corona (if we include the prominences) we could probably identify all 26 of the ions at one point or another. In particular we can watch the thermodynamic state of the corona evolve with space or time, ie see where and when it is hot or cold. Flares offer wonderful opportunities for temperature changes because of the heating resulting from the energy that they extract from the magnetic field.
Loop prominence systems and arcades
Solar flares inject large quantities of chromospheric matter into the corona, and also strongly heat this material. The result is the well-known flare arcade, readily recognized in any EUV or X-ray emission. Many of these Nuggets show examples of such arcades. Before the modern era, though, the phenomenon was already recognized via the Hα line. This presumably shows material at about 104 K. Figure 1 shows a classic view of an Hα "loop prominence systems" from the [Bialkow] observatory. Such loops appear as though magically following a flare, disappear in via flows called "coronal rain." All of this is well understood as the aftermath of the injection of hot matter. Initially it is too hot to be seen in Hα, and indeed this is seen only at the end of the coooling all the way down from temperatures that may fully ionize Fe (depending on the flare).
The Iron cascade
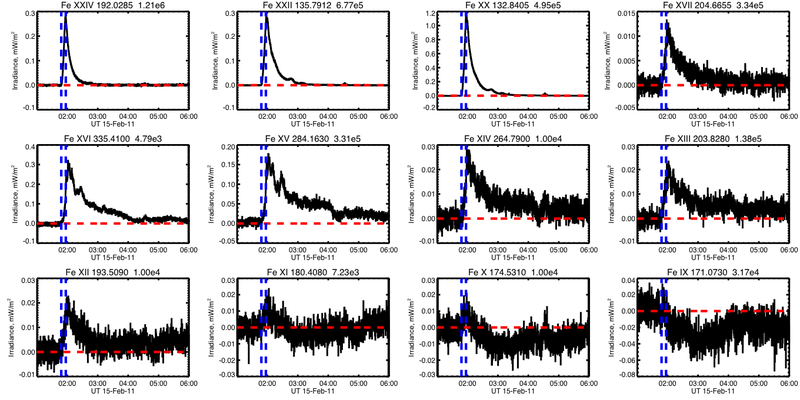
Before the loop prominence system cools to Hα temperature, it is visible to the [EVE spectrometer] in many different ionization states of iron. EVE observes the Sun as a star, and so accepts radiation from an entire arcade (such as that shown in Figure 1), smearing out sources with different temperatures if they are simultaneously present. The plots in Figure 2 and 3 give an "Fe cascade" representation of the time history of a flare (SOL2011-02-14 in this case). This diplay shows a dozen ionization states ranging from Fe +8 to Fe +23 (the lithium-like state) with a few gaps. Each sub-plot shows the peak line flux vs. time as an excess over the preflare background, and in each panel the vertical blue lines show the time range of the hard X-ray RHESSI event, and the dashed red line shows the zero level. Figure 2, covering a time range of 20 minutes, shows the expected cooling fairly clearly: the less-ionized states peak later than the more-ionized states.
Figure 3 shows the Fe cascade over a longer time range (five hours). Here something different appears: The low-excitation Fe states decrease below their preflare levels. This is identifiable with the formation of a CME, as also seen in soft X-ray dimming. Essentially the event blows away a part of the ambient corona, which is seen in these low-excitation lines before the flare.
Conclusions
The Fe cascade plots show something like the expected time evolution of a post-flare loop system. The EVE data have enough signal-to-noise ratio for an X-class flare, such as this one, to learn much more about the time evolution of these systems. Interestingly they may also be able to weigh the mass of a coronal mass ejection in a substantially different manner than that from Thomson scattering observed by a coronagraph.
| RHESSI Nugget Date | 12 March 2012 + |
| RHESSI Nugget First Author | Hugh Hudson + |
| RHESSI Nugget Index | 171 + |


