A (The?) 3D standard model for eruptive flares
From RHESSI Wiki
| Nugget | |
|---|---|
| Number: | 226 |
| 1st Author: | Miho Janvier |
| 2nd Author: | |
| Published: | |
| Next Nugget: | TBD |
| Previous Nugget: | Microwave Images of a Single-Loop Flare: Observations and Simulations |
| List all | |
Contents |
Introduction
Eruptive flares, associated with coronal mass ejections, are important energetic events taking place in the solar corona. The intense magnetic energy release originates from magnetic reconnection, which is also responsible for newly formed magnetic structures. Solar corona observations reveal typical 3D magnetic structures during eruptive flares: flux ropes (twisted magnetic field lines structures), ultimately ejected in the interplanetary medium, and hot and dense flare loops. Magnetic reconnection in 3D takes place in regions of strong gradient of magnetic connectivity, or so-called quasi-separatrix layers (QSLs).
With a 3D MHD simulation recreating the evolution of a flux rope expansion during an eruptive flare [Ref. 1], we propose a 3D-extended, more complete version of the standard model for eruptive-flares. We present below new understandings offered by this model.
New elements of the 3D standard model
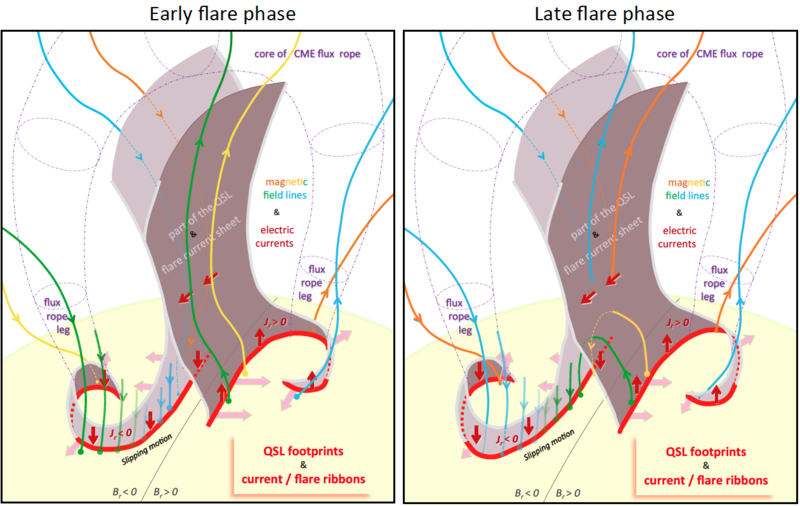
The 3D standard model cartoon is depicted in Figure 1, and shows the evolution of reconnecting magnetic field lines and associated current/flare ribbons. This cartoon sheds light on several processes, listed as follows.
Flare Loops
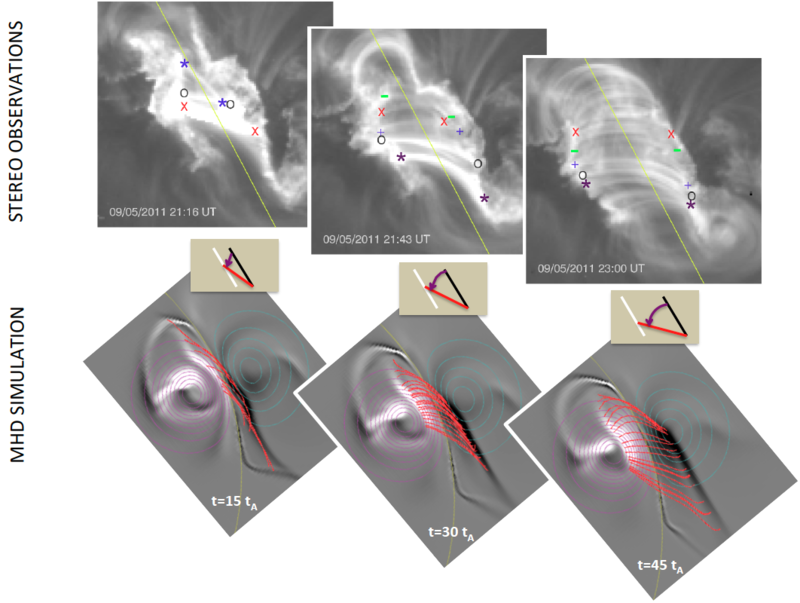
Observations of the formation and the evolution of flare loops usually show a strong-toweak shear evolution (see Figure 2). This transition comes from the reconnection-driven transfer of the differential magnetic shear, from the pre- to the post-eruptive configuration (green and yellow lines in the cartoon), and also from the vertical straightening of the inner legs of the flux rope, which induces an outer shear weakening [Ref. 1].
The flux rope
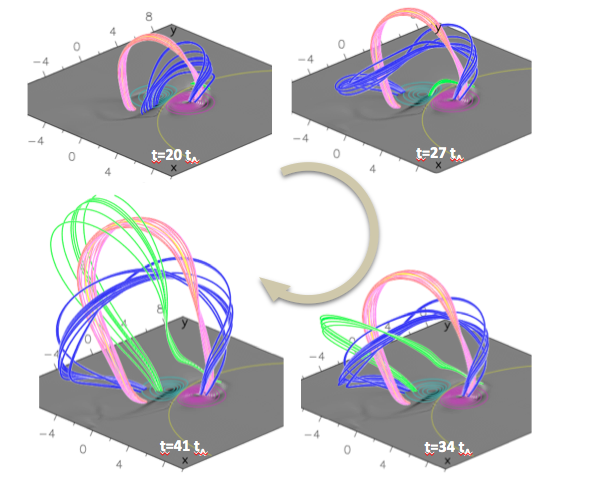
A torus-unstable flux rope core (dashed purple lines in Figure 1), created by photospheric shearing motions/magnetic diffusion, can trigger eruptive flares [Ref. 2]. As field lines undergo reconnection, the flux rope is continuously fed by newly reconnected field lines (blue/green lines, Figure 3). These field lines create the outer envelope of the flux rope and leading to the continuous growth of the expanding flux rope.
Slipping reconnection
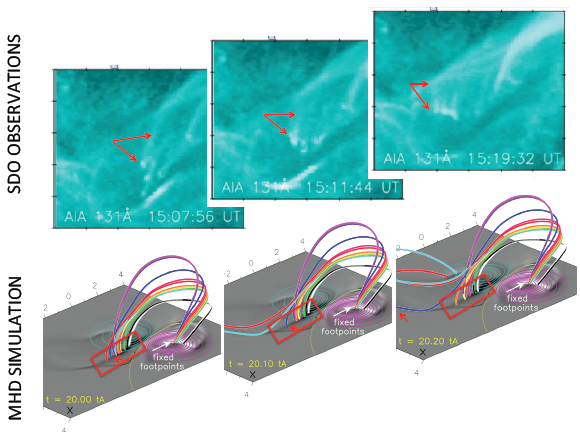
Slipping motion of field lines occurs naturally as a result of successive connectivity changes, and takes place in strong current density region where the magnetic field is strongly distorted (see Ref. 3). Both flare loop arcades and the erupting flux rope undergo slipping reconnection during their formation/evolution process. This intrinsic reconnection regime has recently been observed during an eruptive flare [Ref. 4].
Current / flare ribbons
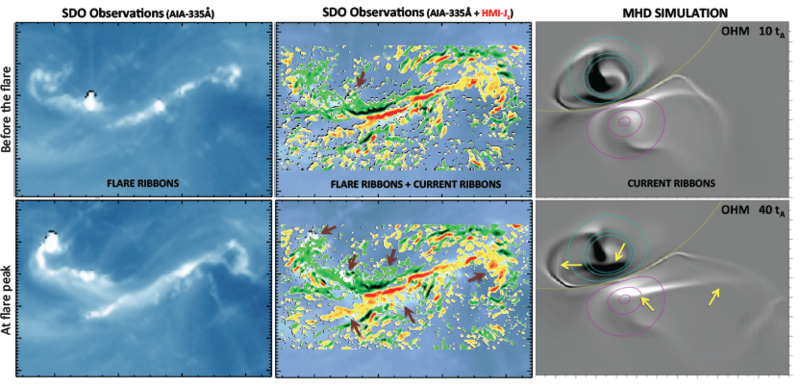
Photospheric currents are the footprints of the coronal current layer. They are located in the same regions as the flare ribbons and the photospheric footprints of the 3D QSL volume [Ref. 5]. As time goes by, current ribbons move away from each other, while field lines being swiped by the coronal current layer further reconnect. During the impulsive flare phase, the currents are seen to increase in the very localized ribbons, due to the collapse of the coronal current sheet.
Conclusion
Our 3D standard model, built from a 3D MHD simulation and which cartoon is presented in Figure 1, extends our understanding of the observational characteristics, as well as the underlying physical mechanisms of eruptive flares. This model shows that both flare loops and flux rope are constructed by 3D reconnection, in the thin coronal current layer that maps as J-shaped current/flare ribbons onto the photosphere. Field lines entering this region reconnect successively, leading to an apparent slipping motion, as recently seen in coronal observations. This change of connectivity allows shear transfer from dynamically evolving pre- to post- reconnected field lines, and is often observed as a strong-to-weak shear transfer in flare loops observations. The flux rope, on the other hand, is constantly growing as reconnected twisted field lines construct its outer shell.
References
[1]
[2]
[3]
[4]
[5]
| RHESSI Nugget First Author | Miho Janvier + |
| RHESSI Nugget Index | 226 + |
