From RHESSI Wiki
Weekly Report 13Aug2010
Comparison of a point source with albedo at disk center and a point source with albedo near the limb
The following is a comparison of a simulated point source with albedo at disk center and a simulated point source with albedo near the limb of the sun. In each case the same imaging technique was used to image the source at disk center and on the limb with identical starting parameters. The differences were the eventlist file used in each case, as one had been separately created for each case, and changing the image center so the field of view would include the source.
Clean
The image below shows the contours for two clean images. The blue contours are for the point source with albedo at disk center. The white contours are the point source with albedo near the limb. This image has been translated so that the 90% contour matches the 90% contour at disk center. Both images were made using detectors 1 - 4.
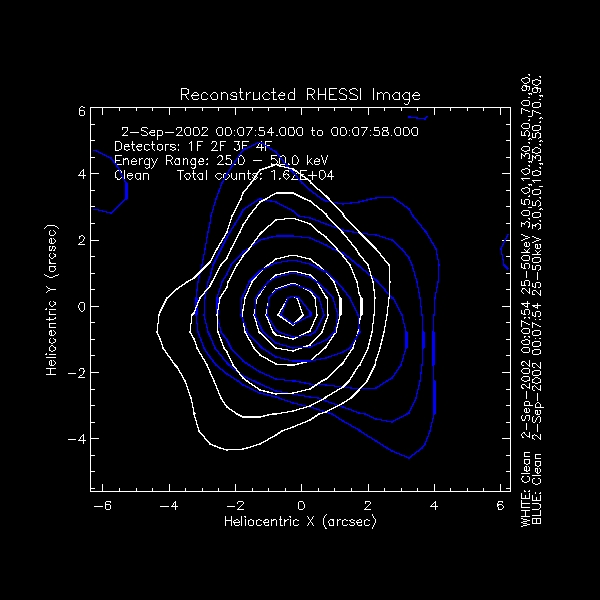
Contours of two clean images. The blue contours are the clean image of a point source with albedo at disk center. The white contours are a clean image of point source with albedo near the limb. It has has been translated to disk center so the 90% contour matches the 90% contour of the image at disk center. Detectors 1 thru 4 were used to create both images.
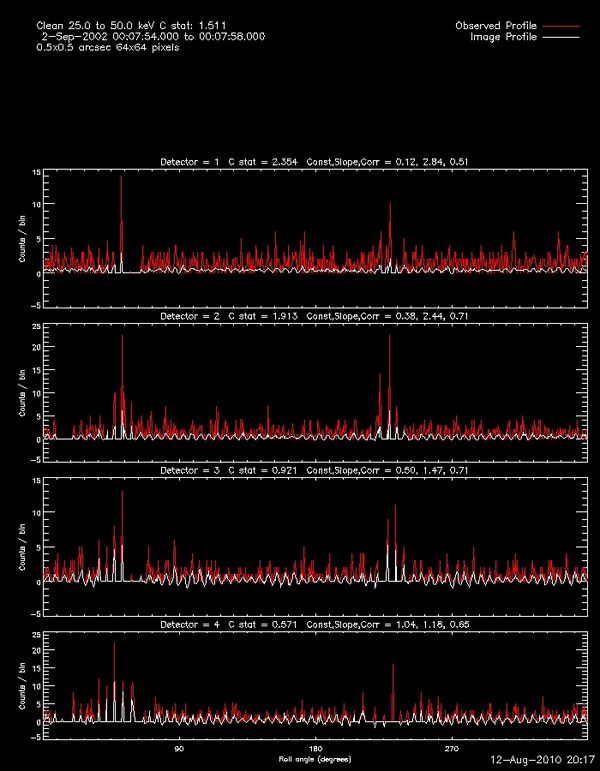
The profiles of the data in each detector used to create the image at disk center along with the fits to those profiles. The data is shown in roll bins.
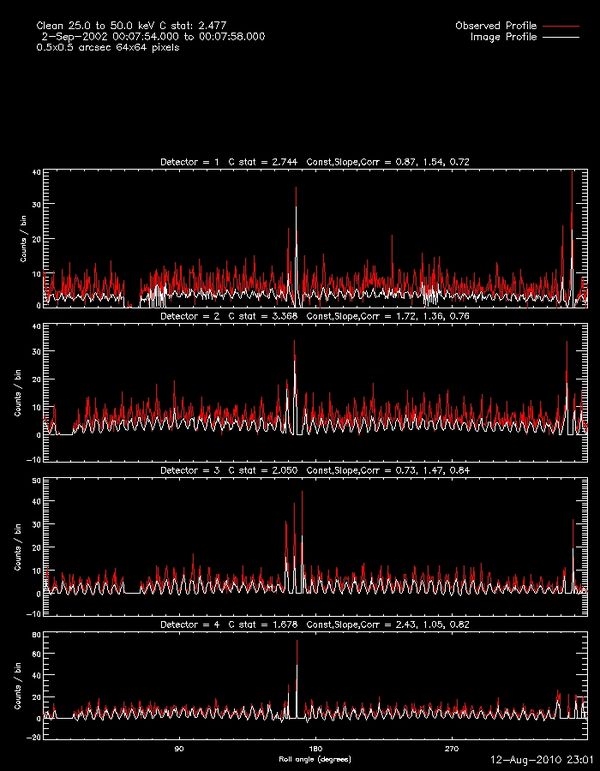
The profiles of each detector used to create the image near the limb along with the fits to those profiles. The data is shown in roll bins.
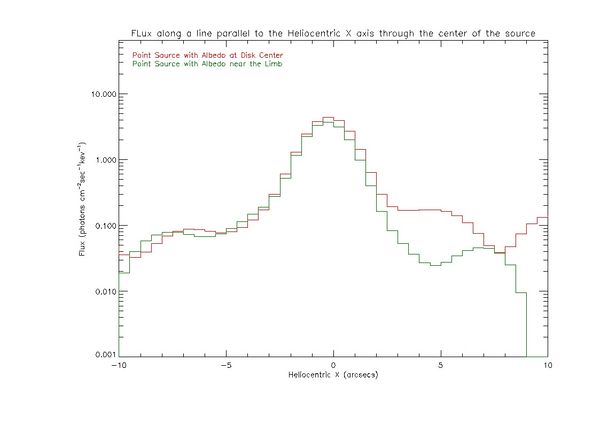
The Flux profiles of each image along a line parallel to the Heliocentric X axis passing through the peak of the source. The red curve is the profile of the image at disk center. The green curve is the profile of the image near the limb. Note the green curved has been divided by a constant so the peak value is near the peak value of the red curve. It has also been translated to disk center. This was done to make it easier to compare the features of the two curves.
Pixon
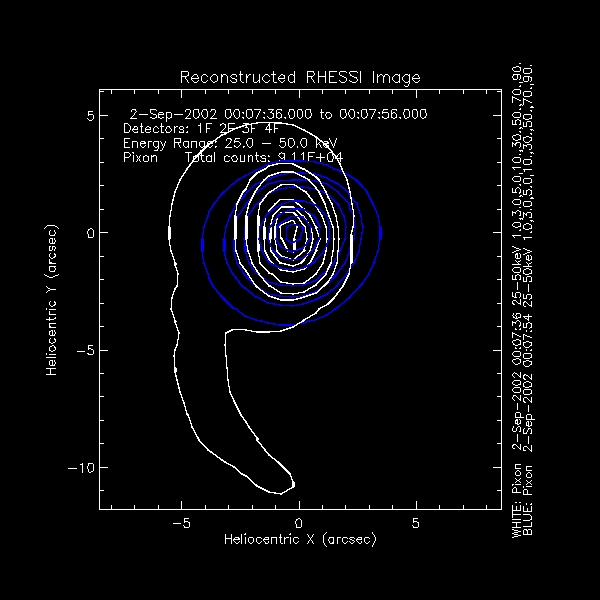
Contours of two Pixon images. The blue contours are the Pixon image of a point source with albedo at disk center. The white contours are the Pixon image of a point source with albedo near the limb.It has has been translated to disk center so the 90% contour matches the 90% contour of the image at disk center. Detectors 1 thru 4 were used to create both images.
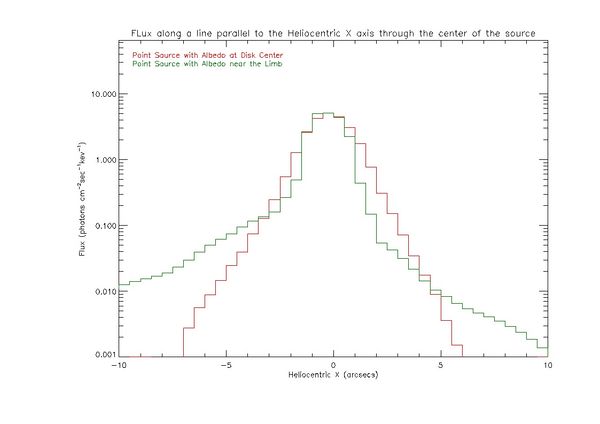
The Flux profiles of each image along a line parallel to the Heliocentric X axis passing through the peak of the source. The red curve is the profile of the image at disk center. The green curve is the profile of the image near the limb. Note the green curved has been divided by a constant so the peak value is near the peak value of the red curve. It has also been translated to disk center. This was done to make it easier to compare the features of the two curves.
UV Smooth


