File:Eve flare lines.png
From RHESSI Wiki
Size of this preview: 800 × 267 pixels
Full resolution (1,200 × 400 pixels, file size: 11 KB, MIME type: image/png)
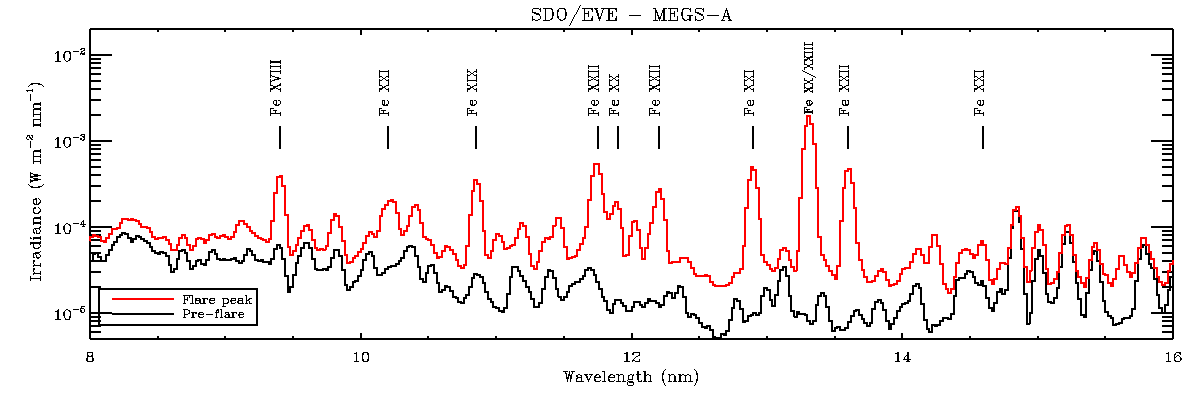
Plot of the 8-16 nm portion of the EVE spectra prior to the start of the X6.9 flare that occurred on 9 August 2011 (black curve) and at the SXR peak (red curve). Lines formed from transitions of highly-ionized iron are noted.
File history
Click on a date/time to view the file as it appeared at that time.
| Date/Time | Thumbnail | Dimensions | User | Comment | |
|---|---|---|---|---|---|
| current | 10:01, 21 May 2012 | 1,200×400 (11 KB) | Rmilligan (Talk | contribs) | (Plot of the 8-16 nm portion of the EVE spectra prior to the start of the X6.9 flare that occurred on 9 August 2011 (black curve) and at the SXR peak (red curve). Lines formed from transitions of highly-ionized iron are noted.) |
- Edit this file using an external application (See the setup instructions for more information)
File links
The following page links to this file: