File:Eve hsi goes plot.png
From RHESSI Wiki
Size of this preview: 622 × 599 pixels
Full resolution (733 × 706 pixels, file size: 326 KB, MIME type: image/png)
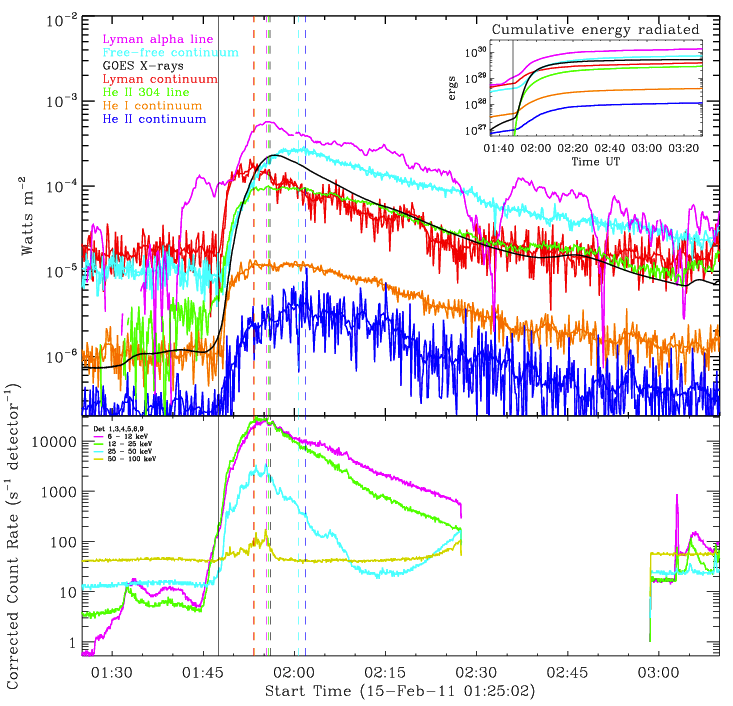
Top panel: lightcurves of free-free, free-bound, and bound-bound emission as observed by EVE during the 15 February 2011 flare. The vertical dashed lines in each panel denote the time of peak emission in each band. Also shown is the GOES 0.1-0.8 nm lightcurve (solid black line). The inset shows the cumulative energy radiated throughout the course of the flare by each process. Bottom panel: RHESSI 6-100 keV lightcurves of the same event. The vertical solid black line in each panel marks the approximate onset time of the continuum emission.
File history
Click on a date/time to view the file as it appeared at that time.
| Date/Time | Thumbnail | Dimensions | User | Comment | |
|---|---|---|---|---|---|
| current | 13:32, 13 January 2012 | | 733×706 (326 KB) | Rmilligan (Talk | contribs) | (Top panel: lightcurves of free-free, free-bound, and bound-bound emission as observed by EVE during the 15 February 2011 flare. The vertical dashed lines in each panel denote the time of peak emission in each band. Also shown is the GOES 0.1-0.8 nm lightc) |
- Edit this file using an external application (See the setup instructions for more information)
File links
The following page links to this file: