Do slow waves trigger pulsations in two-ribbon flares? An observational search
From RHESSI Wiki
Introduction
A recent study by Nakariakov & Zimovets (2011), which was the subject of a recent RHESSI nugget, suggested that quasi-periodic pulsations (QPP) might be explained in two-ribbon flares via slow waves. QPP are periodic-appearing variations in the emission from solar flares, and can be seen in flaring lightcurves at a variety of wavelengths, from radio waves to soft and hard X-rays. The characteristic timescale of these variations can vary from just a few seconds up to several minutes, but their root cause remains the subject of some debate.
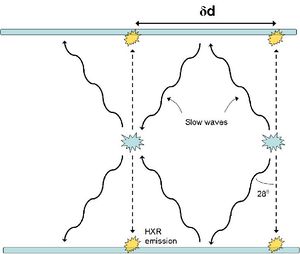
This new theory suggested that slow waves, excited by an initial energy release, could propagate at an angle to the magnetic field linking flare ribbons, reflect in the chromosphere and recombine in the corona at a site further down the flaring arcade, causing another energy release. This process would then repeat all the way down the arcade (see Figure 1 for a cartoon example of this behaviour). These energy releases would then lead to the pulses we observe in flare lightcurves.

Our approach was to consider what observational signatures this kind of regime may have, and then search for these signatures using RHESSI. For this case study we selected three flares, from 2002 November 9, 2005 January 19 and 2005 August 22. RHESSI allows us to measure the movement of the hard X-ray footpoints for these flares, as we can see in Figure 2.
Footpoint velocities and pulse timings
The first observable we consider is the relationship between hard X-ray pulse timings and the separation of hard X-ray footpoints. If the footpoints move closer together during a flare, the travel path of the slow waves also grows shorter, thus it may be that the interval between successive hard X-ray pulses would also grow shorter. We test this by comparing the pulse interval with the footpoint separation for each event (Figure 3). For these flares, the figure indicates that there is no clear correlation between the footpoint separation and the pulse timings.
Footpoint velocities at lightcurve peaks and valleys
Our second test involves measuring the velocity of footpoints as they move along the arcade ribbons. If the slow wave mechanism were to be true, we might expect the footpoints to jump from one location to another, rather than progressing smoothly along the ribbon. As a result the velocity of the footpoints would be roughly zero while the hard X-ray pulse was occuring, but large or discontinuous in the intervening time. Figure 4 shows our measurements of the 2002 November 9 flare. In the top panel we track the distance travelled by both footpoints from their starting locations at the flare onset. For this flare both footpoints travel more than 30 Mm along their respective ribbons, over a timeframe of 10 minutes. The centre panel shows the velocity as a function of time of these footpoints, while the bottom panel shows only the measurements made at the times when lightcurve peaks and valleys occur.

For this flare we did not see a systematic difference in footpoint velocities between lightcurve peaks and valleys. The bottom panel of this figure shows that the instantaneous velocity measurements are quite widely scattered, but that the valley measurements (blue points) are not obviously closer to zero than their orange counterparts (peaks). We performed the same measurements for the other two flares, with similar results - but for brevity we omit them here.