File:162f2.png
From RHESSI Wiki

Size of this preview: 800 × 231 pixels
Full resolution (1,200 × 347 pixels, file size: 176 KB, MIME type: image/png)
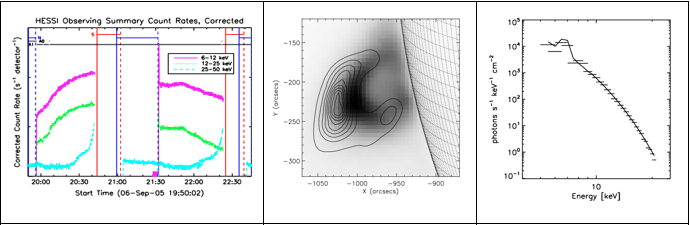
Left: RHESSI light curves in three energy bands for the flare SOL2005-09-06. Middle: a GOES/SXI image during the rise phase; the contours show RHESSI emission at 8-9 keV with 10% contour levels. Right: RHESSI spectrum of the loop-top source at 20:37 UT. Horizontal bars correspond to the energy bin widths. The fit consists of a thermal component and two spectral line complexes (at 6.7 keV and 8.0 keV).
File history
Click on a date/time to view the file as it appeared at that time.
| Date/Time | Thumbnail | Dimensions | User | Comment | |
|---|---|---|---|---|---|
| current | 18:04, 26 October 2011 | 1,200×347 (176 KB) | TomekMrozek (Talk | contribs) | ||
| 16:38, 25 October 2011 | 690×225 (83 KB) | Hhudson (Talk | contribs) | (Left: RHESSI light curves in three energy bands for the flare SOL2005-09-06. Middle: a [http://en.wikipedia.org/wiki/Solar_X-ray_Imager GOES/SXI] image during the rise phase; the contours show RHESSI emission at 8-9 keV with 10% contour levels. Right: RHE) |
- Edit this file using an external application (See the setup instructions for more information)
File links
The following page links to this file: