Kernels and Ribbons
From RHESSI Wiki
| Nugget | |
|---|---|
| Number: | 129 |
| 1st Author: | Jiong QIU |
| 2nd Author: | |
| Published: | 2010 June 14 |
| Next Nugget: | RHESSI coronal seismology |
| Previous Nugget: | Awesome Stellar Flare Spectra |
| List all | |
Introduction
A solar flare has a complicated three-dimensional structure involving all layers of the solar atmosphere. Many of the models that we use to explain them, though, are inherently two-dimensional and indeed often involve the concept of the current sheet, geometrically a manifold with only two dimensions. On the other hand, modern theories of magnetic reconnection require three-dimensionality to make the plasma physics work.
Many of the observations also seem to point to intrinsic two-dimensionality. Chief among these are the flare ribbons, the magnetic footpoints of an arcade of loops that looks entirely consistent with the presence of a large-scale current sheet in the solar corona. One observation that generally does not agree with this picture is the hard X-ray picture (e.g. RHESSI's), and this one is fundamentally important to understand because the hard X-rays show us where the flare energy appears. Instead of ribbons, the hard X-rays usually show a much simpler structure, often two bright compact sources termed "footpoints" on the reasonable assumption that they show the two ends of a thin coronal magnetic loop. This nugget studies the fine structure of footpoints (seen in hard X-rays) and ribbons (seen in the UV) in a search for an answer to the simple geometrical (2D vs 3D?) question.
Revisiting the Bastille Day Flare
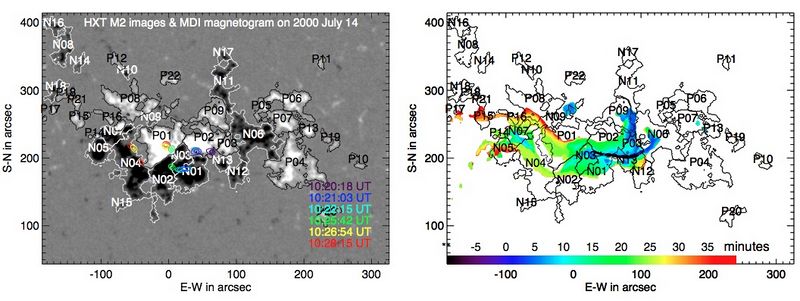
To explore the relationship between hard X-ray and UV emissions at the feet of flare loops, we revisit one of the best known two-ribbon flares, the Bastille day [1], which occurred at 10 UT on 2000 July 14, and was observed by Yohkoh and [2] among others. Figure 1 gives snapshots of the flare evolution that these satellites measured in hard X-ray and UV wavelengths, superimposed on an array of [magnetic poles], a simple way to model the complicated solar magnetic field. The color code shows evolution of UV brightening, which spreads both along the magnetic polarity inversion line (PIL) in a nearly organized manner from the west to the east and perpendicular to and away from the PIL as would be expected in the 2D reconnection model. The hard X-ray images in the left panel are obtained by the Maximum Entropy Method embedded in the SolarSoftware package. The >20 keV hard X-ray emission of the flare exhibits 2 to 3 compact sources in magnetic fields of opposite polarities. During the flare evolution, the hard X-ray sources gradually shift along the PIL, similar to the evolution pattern of UV brightening. Figure 2 shows the light curves of the flare observed in hard X-ray, UV 1600~\AA continuum, and soft X-ray 1-8\AA\ by GOES. The UV light curve is a sum of all counts in UV images. It rises and peaks together with hard X-rays, but decays more slowly well after the decay of hard X-rays. Note that for this flare, Yohkoh/HXT only observed from 10:20~UT.

The revisit raises some interesting questions. First, obviously, the evolution and mapping of UV and hard X-ray
sources reflect the pattern of magnetic reconnection which is not entirely 2-dimensional, and second,
the coincident rise and peak but delayed decay in UV emission with respect to hard X-ray emission
suggests some different physics, not directly related to hard X-ray producing process, taking
place during the gradual decay of UV emission.
| RHESSI Nugget Date | 14 June 2010 + |
| RHESSI Nugget First Author | Jiong QIU + |
| RHESSI Nugget Index | 129 + |