Microflares in Sectors
From RHESSI Wiki
Lsvalgaard (Talk | contribs) m |
|||
| Line 52: | Line 52: | ||
thus structure.]] | thus structure.]] | ||
| - | This distinction (Hale or not) strongly organizes solar activity of | + | This distinction (Hale or not) strongly organizes solar activity of various sorts. |
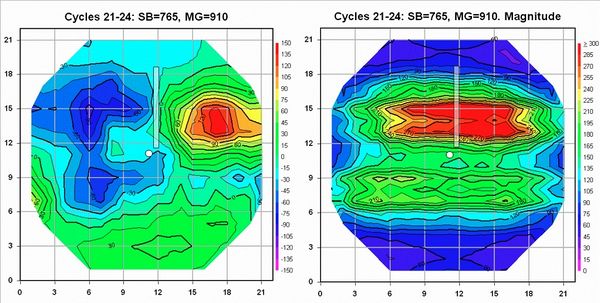
| - | various sorts. | + | In Figure 2 we show this with the magnetograms from the [http://wso.stanford.edu/ Wilcox Solar Observatory], which specializes |
| + | in the global synoptic magnetic observations needed for this purpose. | ||
On average, what causes the warps in the current sheet (anmd hence | On average, what causes the warps in the current sheet (anmd hence | ||
the sector boundary at Earth) strongly tends to originate from | the sector boundary at Earth) strongly tends to originate from | ||
one hemisphere, namely that which has the Hale boundary. | one hemisphere, namely that which has the Hale boundary. | ||
Coronal holes are often found co-located with the interiors of the sectors. | Coronal holes are often found co-located with the interiors of the sectors. | ||
| + | |||
| + | [[Image:137figx.jpg|center|thumb|600px|Figure 2: The average magnetograms for a nominal (+,-) Hale boundary during solar cycle 23. 910 magnetograms superposed on 765 sector boundaries using the [http://wso.stanford.edu/ Wilcox Solar Observatory] observations 1976-2010. Some data has been mirrored and sign-reversed as described in the text to reduce all data to the situation for cycle 23. The Hale portion of the sector boundary is marked by the semi-transparent bar. Left Figure shows the average signed field, while the right-hand Figure shows the average unsigned (total) field.]] | ||
== RHESSI evidence for photospheric sector boundaries == | == RHESSI evidence for photospheric sector boundaries == | ||
| Line 65: | Line 68: | ||
flux from active regions with strong magnetic fields so we expect | flux from active regions with strong magnetic fields so we expect | ||
the concentration of total flux at the Hale boundary as shown in | the concentration of total flux at the Hale boundary as shown in | ||
| - | the right-hand side of Figure | + | the right-hand side of Figure 1. The closed field lines associated |
with the active regions would trap coronal material, explaining the | with the active regions would trap coronal material, explaining the | ||
enhanced brightness of the green corona at Hale boundaries. | enhanced brightness of the green corona at Hale boundaries. | ||
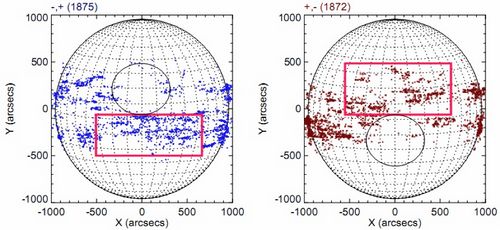
| - | [[Image:137fig2.jpg|center|thumb|500px|Figure | + | [[Image:137fig2.jpg|center|thumb|500px|Figure 3: Distribution of RHESSI flares on each day a sector boundary was mapped back to central meridian for part of solar cycle 23, March 2002 to March 2008. The red boxes show where flares are expected based on association with strong magnetic fields: at the Hale boundary. The circles show that hardly any flares occur near a non-Hale boundary.]] |
We would also expect flares and microflares to occur preferentially | We would also expect flares and microflares to occur preferentially | ||
near the Hale boundary. Using the RHESSI flare list covering the | near the Hale boundary. Using the RHESSI flare list covering the | ||
interval March 2002 to March 2008 (wholly within cycle 23) we find, | interval March 2002 to March 2008 (wholly within cycle 23) we find, | ||
| - | indeed, that to be the case (Figure | + | indeed, that to be the case (Figure 3). |
GOES flares for May 1996 to January 2009 (cycle 23) show the same | GOES flares for May 1996 to January 2009 (cycle 23) show the same | ||
distribution, albeit with poorer statistics because of the | distribution, albeit with poorer statistics because of the | ||
| Line 80: | Line 83: | ||
We can quantify the asymmetry by integrating the count in longitude | We can quantify the asymmetry by integrating the count in longitude | ||
| - | between 30 degrees on either side of Central Meridian, Figure | + | between 30 degrees on either side of Central Meridian, Figure 4; |
the correlation between the polarity of the solar Mean Field (over | the correlation between the polarity of the solar Mean Field (over | ||
a smaller disk centered on the sun-Earth point) and the polarity | a smaller disk centered on the sun-Earth point) and the polarity | ||
| Line 87: | Line 90: | ||
side of Central Meridian. | side of Central Meridian. | ||
| - | [[Image: | + | [[Image:137fig4.jpg|center|thumb|500px|Figure 3: Number of flare events within 30 degrees of Central Meridian at times of sector boundaries, as a function of latitude, for the RHESSI sample (left) and for the GOES sample (right).]] |
== Conclusion == | == Conclusion == | ||
Latest revision as of 13:45, 3 October 2010
| Nugget | |
|---|---|
| Number: | 137 |
| 1st Author: | Leif Svalgaard |
| 2nd Author: | Iain Hannah |
| Published: | 2010 October 4 |
| Next Nugget: | TBD |
| Previous Nugget: | Sun III |
| List all | |
Contents |
Introduction
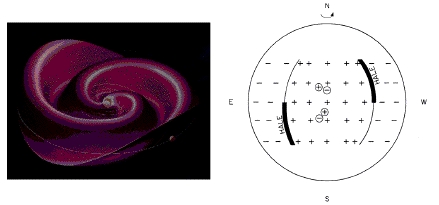
The [solar wind] has a remarkable "sector structure": the radial component of the magnetic field either points away from the Sun or towards it, and there is large-scale organization of this dichotomy. This results from the dominance of large-scale current sheet in the heliosphere, necessary (from Maxwell's equations) to separate the polarities. When the heliospheric current sheet (Figure 1, left) overtakes the Earth (or a spacecraft) an abrupt change of magnetic polarity (away from the Sun or towards the Sun) is observed: we call this a "sector boundary."
What is a "Hale Boundary"?
Sector boundaries observed at Earth map back to a magnetic neutral line at the central meridian in the corona and also to a property of the originating photospheric magnetic field about 4.5 days earlier. This is the approximate transit time of the solar wind. The neutral line in the photosphere is on average meridional feature, i.e. organized along longitudes.
Active regions each have a photospheric neutral line too. Thix divides the opposite polarities in opposite hemispheres (Hale's law). The opposite polarities of the active-region fields famously alternate; systematically, the "preceding" polarity, in the sense of solar rotation, will be of one sign in one hemisphere and the other sign in the other. This reverses every 11 years, approximately, and the full 22-year variation is called the Hale Cycle. When the polarities of the sector boundary match those of the active region, we call this a "Hale Boundary" (reference [A]); see Figure 1, right.
This distinction (Hale or not) strongly organizes solar activity of various sorts. In Figure 2 we show this with the magnetograms from the Wilcox Solar Observatory, which specializes in the global synoptic magnetic observations needed for this purpose. On average, what causes the warps in the current sheet (anmd hence the sector boundary at Earth) strongly tends to originate from one hemisphere, namely that which has the Hale boundary. Coronal holes are often found co-located with the interiors of the sectors.

RHESSI evidence for photospheric sector boundaries
One important (maybe the only?) source of the open flux and solar wind is the dispersal of magnetism from the active regions. flux from active regions with strong magnetic fields so we expect the concentration of total flux at the Hale boundary as shown in the right-hand side of Figure 1. The closed field lines associated with the active regions would trap coronal material, explaining the enhanced brightness of the green corona at Hale boundaries.

We would also expect flares and microflares to occur preferentially near the Hale boundary. Using the RHESSI flare list covering the interval March 2002 to March 2008 (wholly within cycle 23) we find, indeed, that to be the case (Figure 3). GOES flares for May 1996 to January 2009 (cycle 23) show the same distribution, albeit with poorer statistics because of the smaller number of cases.
We can quantify the asymmetry by integrating the count in longitude between 30 degrees on either side of Central Meridian, Figure 4; the correlation between the polarity of the solar Mean Field (over a smaller disk centered on the sun-Earth point) and the polarity of the Heliospheric Magnetic Field maximizes for a disk radius of 0.5 solar radius, justifying the choice of 30 degrees on either side of Central Meridian.
Conclusion
In a sense, all this is trivial, and just what we would expect. On the other hand the patterns we have discovered emphasize the high degree of coherence in the organization of solar magnetic activity on large scales, something that may not be well-understood theoretically but which presumably links the sector structure at one AU to the . deep interior of the Sun.
References
(A) The Hale solar sector boundary
| RHESSI Nugget Date | 4 October 2010 + |
| RHESSI Nugget First Author | Leif Svalgaard + |
| RHESSI Nugget Index | 137 + |
| RHESSI Nugget Second Author | Iain Hannah + |
