File list
From RHESSI Wiki
This special page shows all uploaded files. By default the last uploaded files are shown at top of the list.
A click on a column header changes the sorting.| Name | User | Size | Description | Versions | |
|---|---|---|---|---|---|
| 00:36, 3 October 2008 | RHESSI_may_image.gif (file) | Wikisysop | 313 KB | (RHESSI visible light image of the Sun for the month of May, 2003.) | 1 |
| 18:26, 3 October 2008 | RHESSI_optical_images_icon.png (file) | Wikisysop | 302 KB | (Icon for RHESSI optical images Nugget) | 1 |
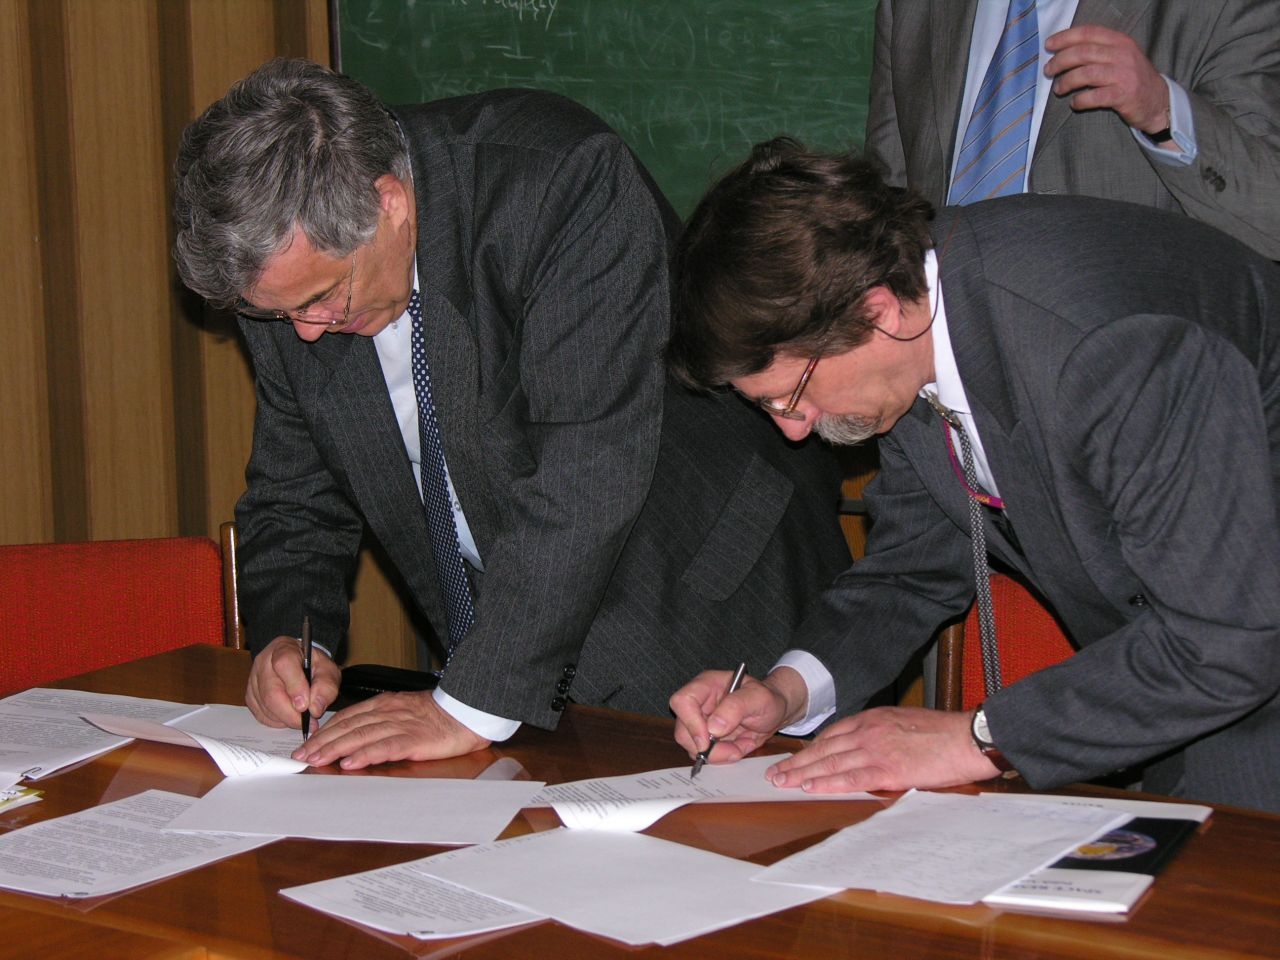
| 16:55, 15 October 2008 | CORONAS_signing.jpg (file) | Schriste | 422 KB | (Professor Janusz Sylwester (Polish Academy of Sciences, Wroclaw, Poland: right) signs the protocol with Professor Yury Kutov of the Moscow Engineering--Physical Institute, Project Scientist of CORONAS-Photon, Warsaw, April 2006. ) | 1 |
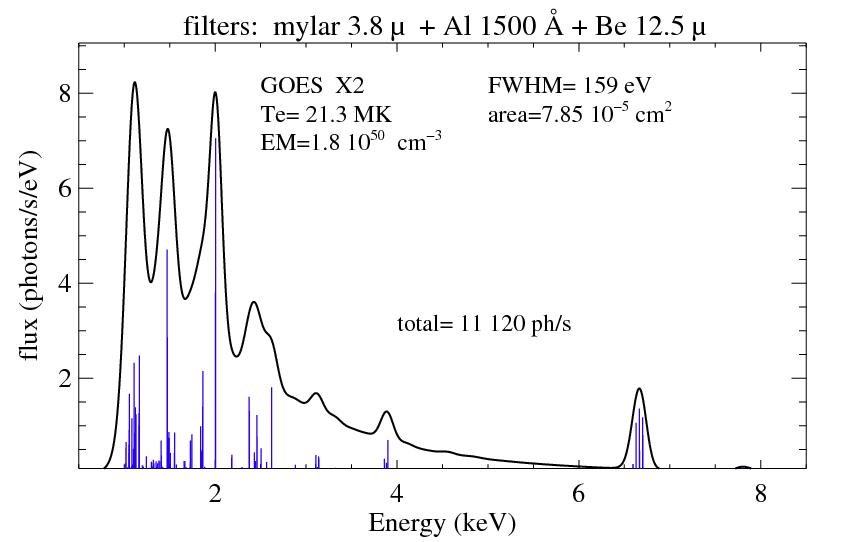
| 16:57, 15 October 2008 | SPHINX_simulated_spectra.jpg (file) | Schriste | 44 KB | (Simulated X-ray spectra in the 0-12 keV range for a solar coronal plasma with temperatures 5, 10, and 25 MK. Chief line features are identified by element symbols. The spectral resolution approximately matches that expected for the SphinX detectors. ) | 1 |
| 16:58, 15 October 2008 | SPHINX_schematic.jpg (file) | Schriste | 60 KB | (Schematic of the SphinX instrument. Sunlight is incident from the top via the input apertures which are 5 degree collimators. The X-rays are detected by Si PIN detectors, 20 mm2, manufactured by Amptek (USA). ) | 1 |
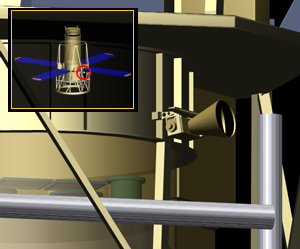
| 01:15, 16 October 2008 | Cryocooler.gif (file) | Schriste | 34 KB | (Photograph of the RHESSI cryocooler) | 1 |
| 01:28, 16 October 2008 | Hessi_ras.jpg (file) | Schriste | 23 KB | (Image of the RHESSI Roll Angle System.) | 1 |
| 01:32, 16 October 2008 | Attitude_control_subsystem.gif (file) | Schriste | 27 KB | (A diagram of the RHESSI attitude control subsystem) | 1 |
| 16:02, 16 October 2008 | SPHINX_photo.jpg (file) | Schriste | 24 KB | (Photograph of the SphinX instrument ready for delivery to the CORONAS-PHOTON spacecraft) | 1 |
| 01:04, 21 October 2008 | Radio_Spectrum_08142008.jpg (file) | Schriste | 117 KB | (The event of August 14, 2004 observed by the Phoenix-2 radio spectrometer (top) and the RHESSI X-ray satellite (bottom). The event was selected for detailed analysis. The radio spectrum was cleaned from interference and shows a decimetric pulsation. The X) | 1 |
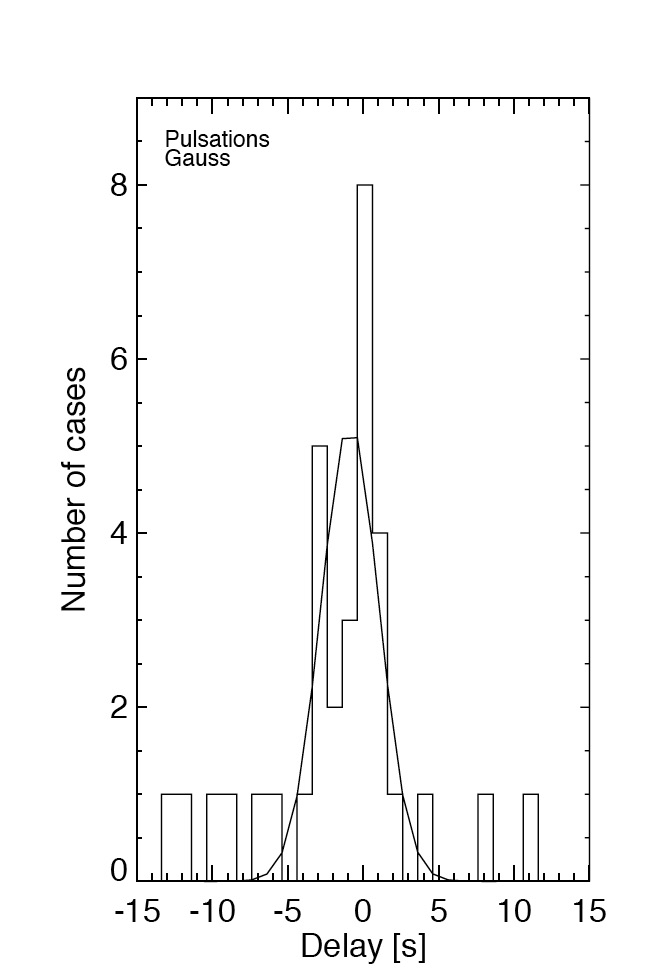
| 01:08, 21 October 2008 | Pulsation_Xray_time_delay.jpg (file) | Schriste | 61 KB | 1 | |
| 01:12, 21 October 2008 | Spikes_Xray_time_delay.jpg (file) | Schriste | 59 KB | 1 | |
| 19:30, 22 October 2008 | MESSENGER_spacecraft.jpg (file) | Schriste | 42 KB | (Artist's impression of MESSENGER in orbit about Mercury, showing the sunshade on which the XRS solar monitor is mounted.) | 1 |
| 19:32, 22 October 2008 | XRS_lightcurve.jpg (file) | Schriste | 134 KB | (X-ray light curves measured with XRS in four energy bands for the flare starting at 14:30 UT on 1 June 2007. Note that the lower energies show the typical later peak times and longer decay times compared to the higher energies.) | 1 |
| 19:34, 22 October 2008 | XRS_fit_spectrum_01072007.jpg (file) | Schriste | 90 KB | (MESSENGER XRS spectrum with CHIANTI thermal best-fits. Blue histogram: background-subtracted X-ray count-rate spectrum measured with XRS at the time of peak temperature during the flare starting at 14:30 UT on 1 June 2007. Green and yellow curves: CHIANTI) | 1 |
| 19:36, 22 October 2008 | XRS_line_spectrum_01072007.jpg (file) | Schriste | 87 KB | (Continuum and line contributions to the measured XRS count-rate spectrum. The black curve is the best fit to the XRS count-rate spectrum and the colored lines are the contributions from the continuum and the line complexes from the different elements, as ) | 1 |
| 19:37, 22 October 2008 | XRS_fip_models.jpg (file) | Schriste | 68 KB | (FIP bias vs. FIP for two different models of coronal abundances used by CHIANTI and for the XRS-measured values for Fe, Ca, Si, and S averaged over five ~M-class flares.) | 1 |
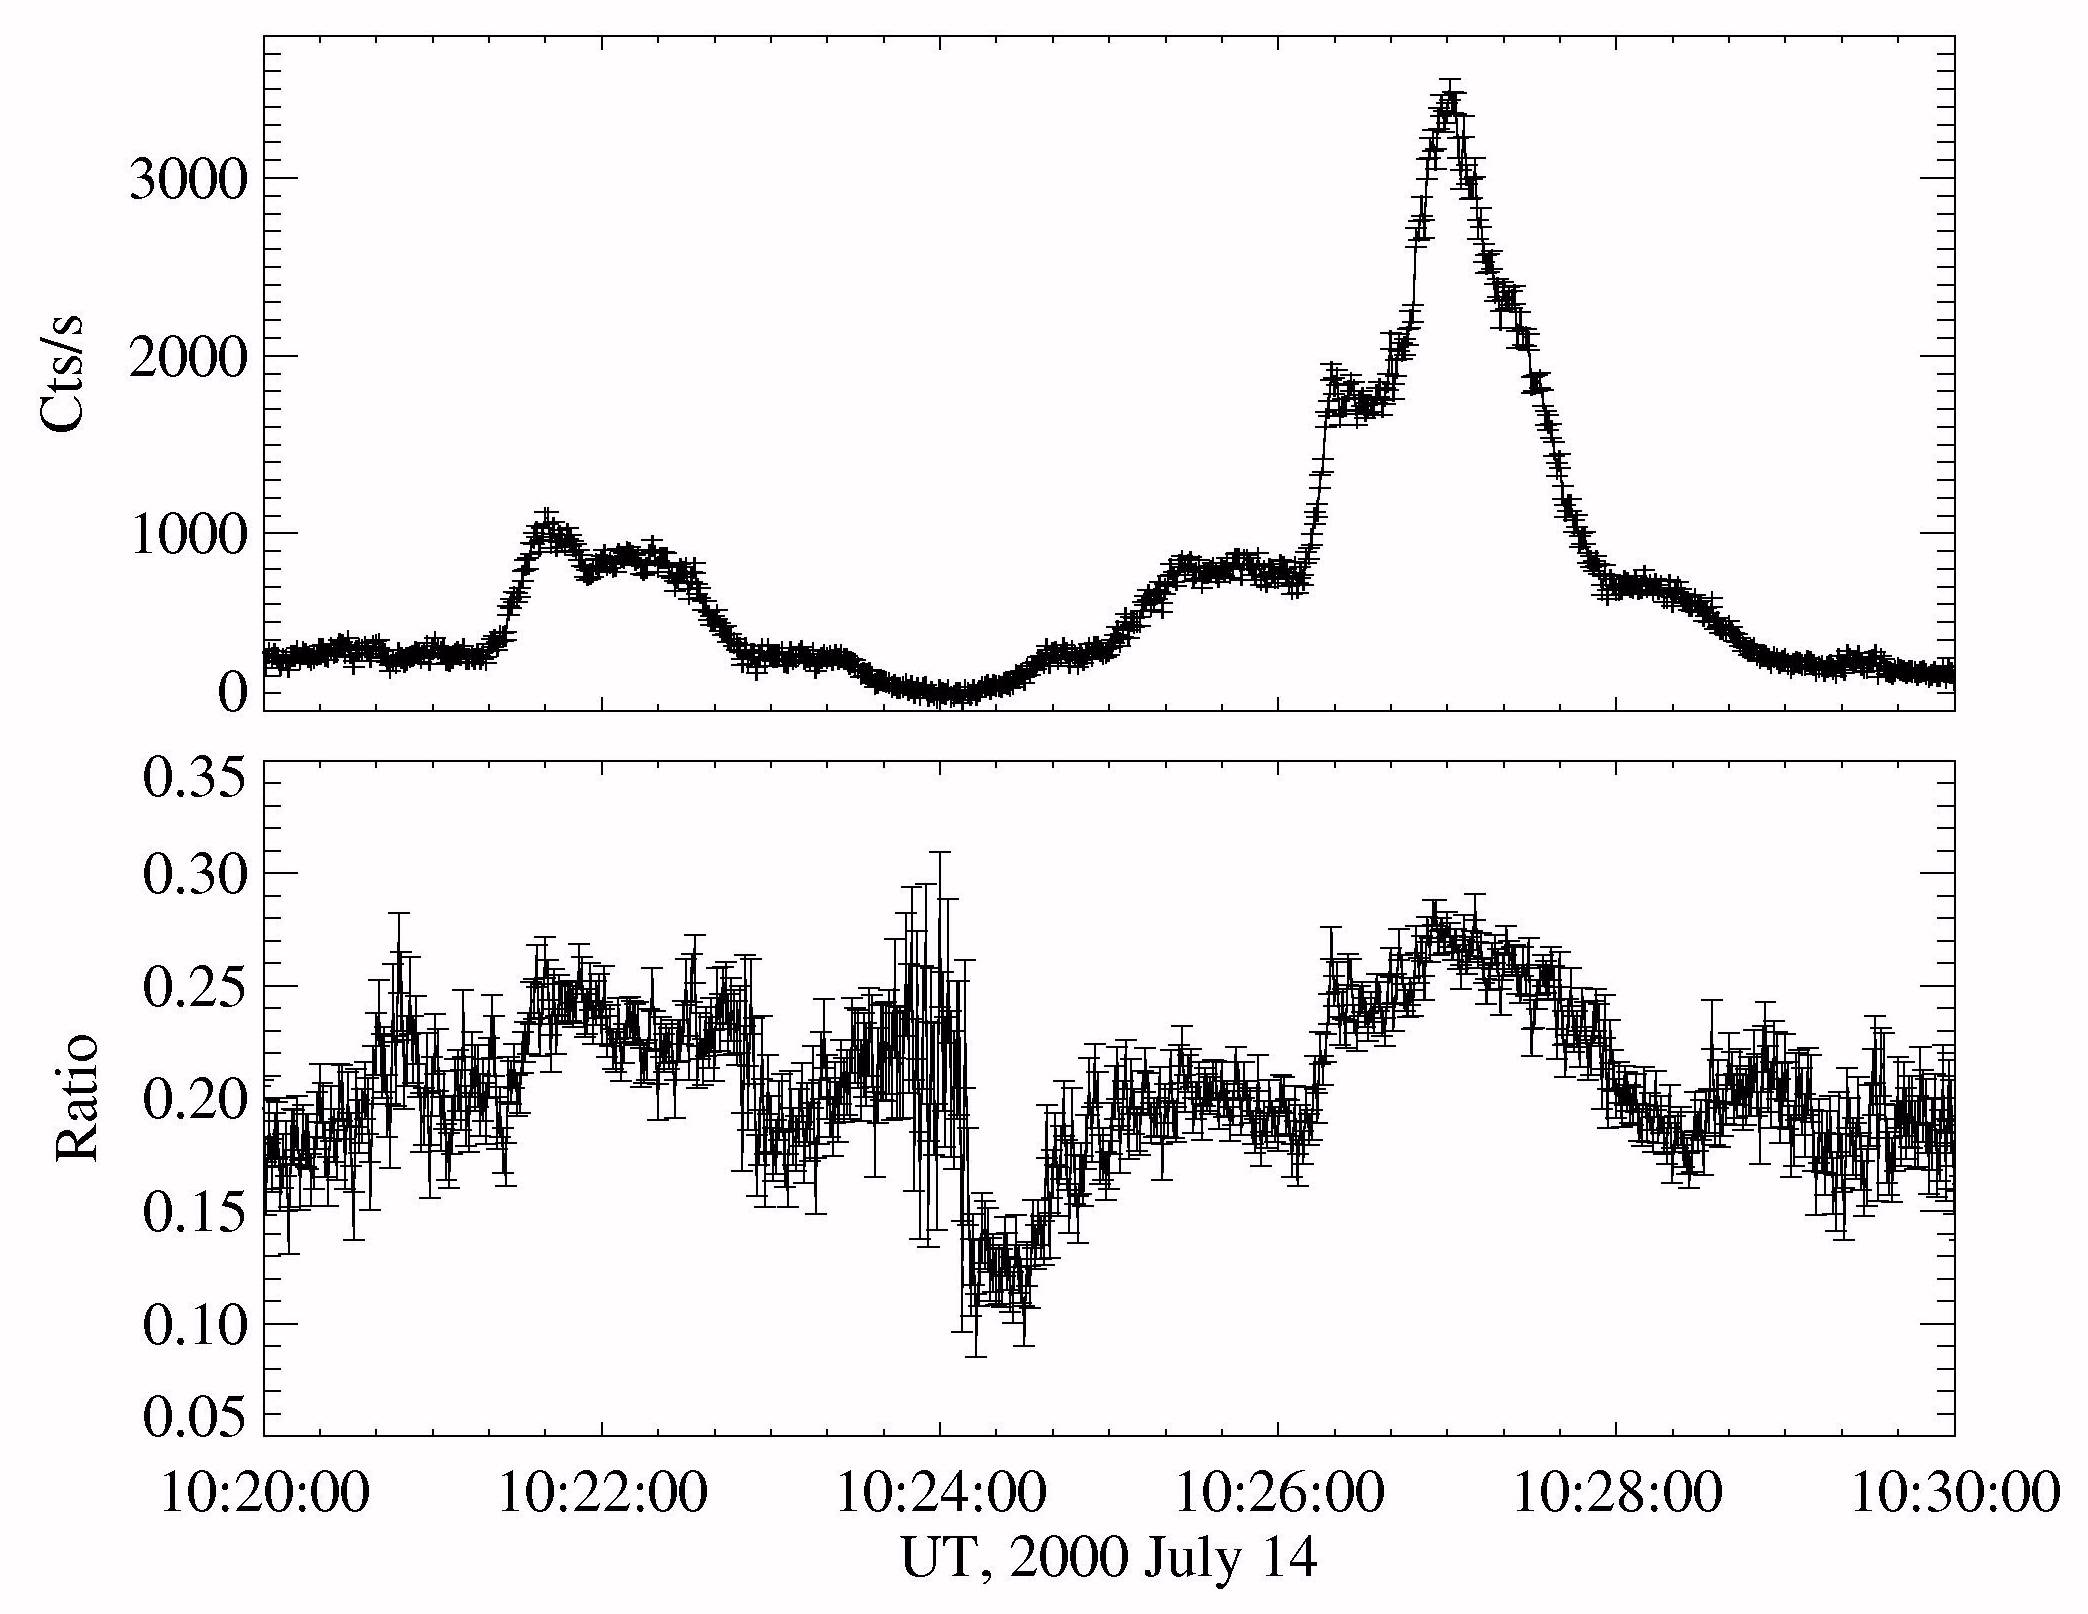
| 21:44, 31 October 2008 | Yohkoh_countrate_08142000.jpg (file) | Schriste | 282 KB | (Yohkoh counting rate for the 14 July 2000 events in ~100-200 keV (top panel) and ~100 – 200 keV/~50 – 100 keV hardness ratio (bottom panel) for the 2000 July 14 solar flare.) | 1 |
| 21:47, 31 October 2008 | Yohkoh_countrate_15042001.jpg (file) | Schriste | 260 KB | (Yohkoh counting rate in ~100-200 keV counting rate (top panel) and ~100 – 200 keV/~50 – 100 keV hardness ratio for the 2001 April 15 solar flare.) | 1 |
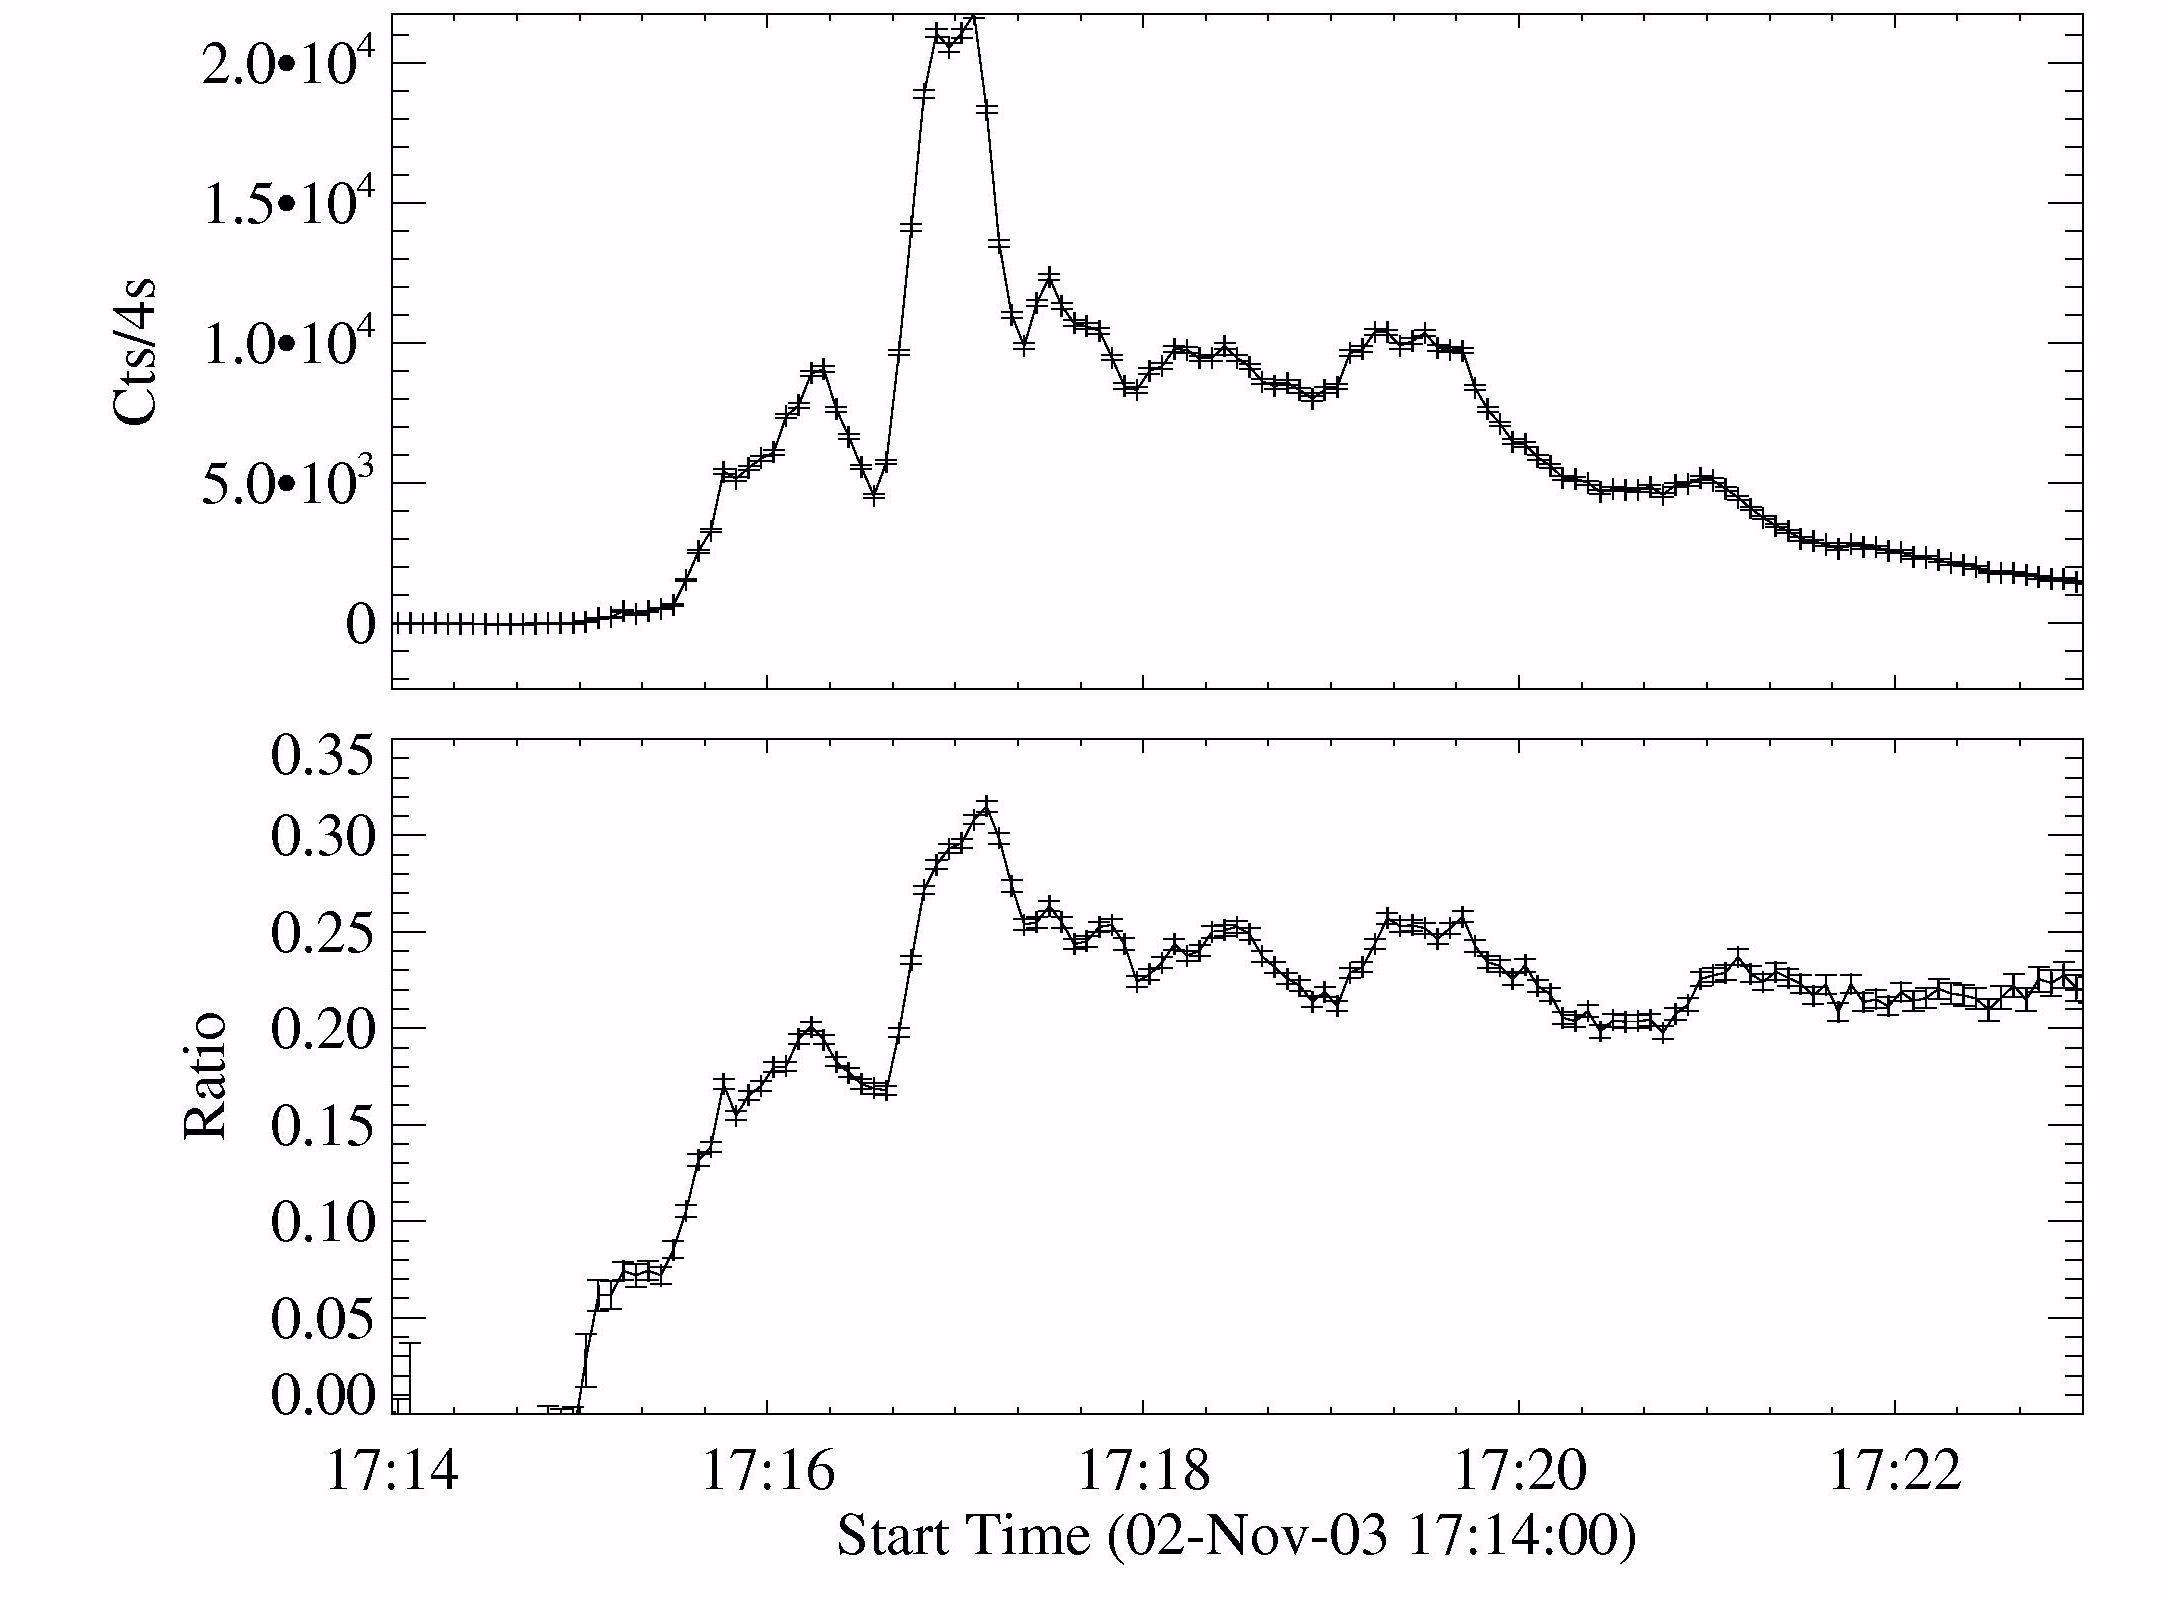
| 21:49, 31 October 2008 | RHESSI_countrate_02112003.jpg (file) | Schriste | 213 KB | (RHESSI 100-200 keV counting rate (top panel) and 100 – 200 keV/50 – 100 keV hardness ratio for the 2003 November 02 solar flare.) | 1 |
| 21:52, 31 October 2008 | Yohkoh_countrate_06051998.jpg (file) | Schriste | 258 KB | (Yohkoh ~100-200 keV counting rate (top panel) and ~100 – 200 keV/~50 – 100 keV hardness ratio (bottom panel) for the second peak of the 1998 May 6 solar flare. ) | 1 |
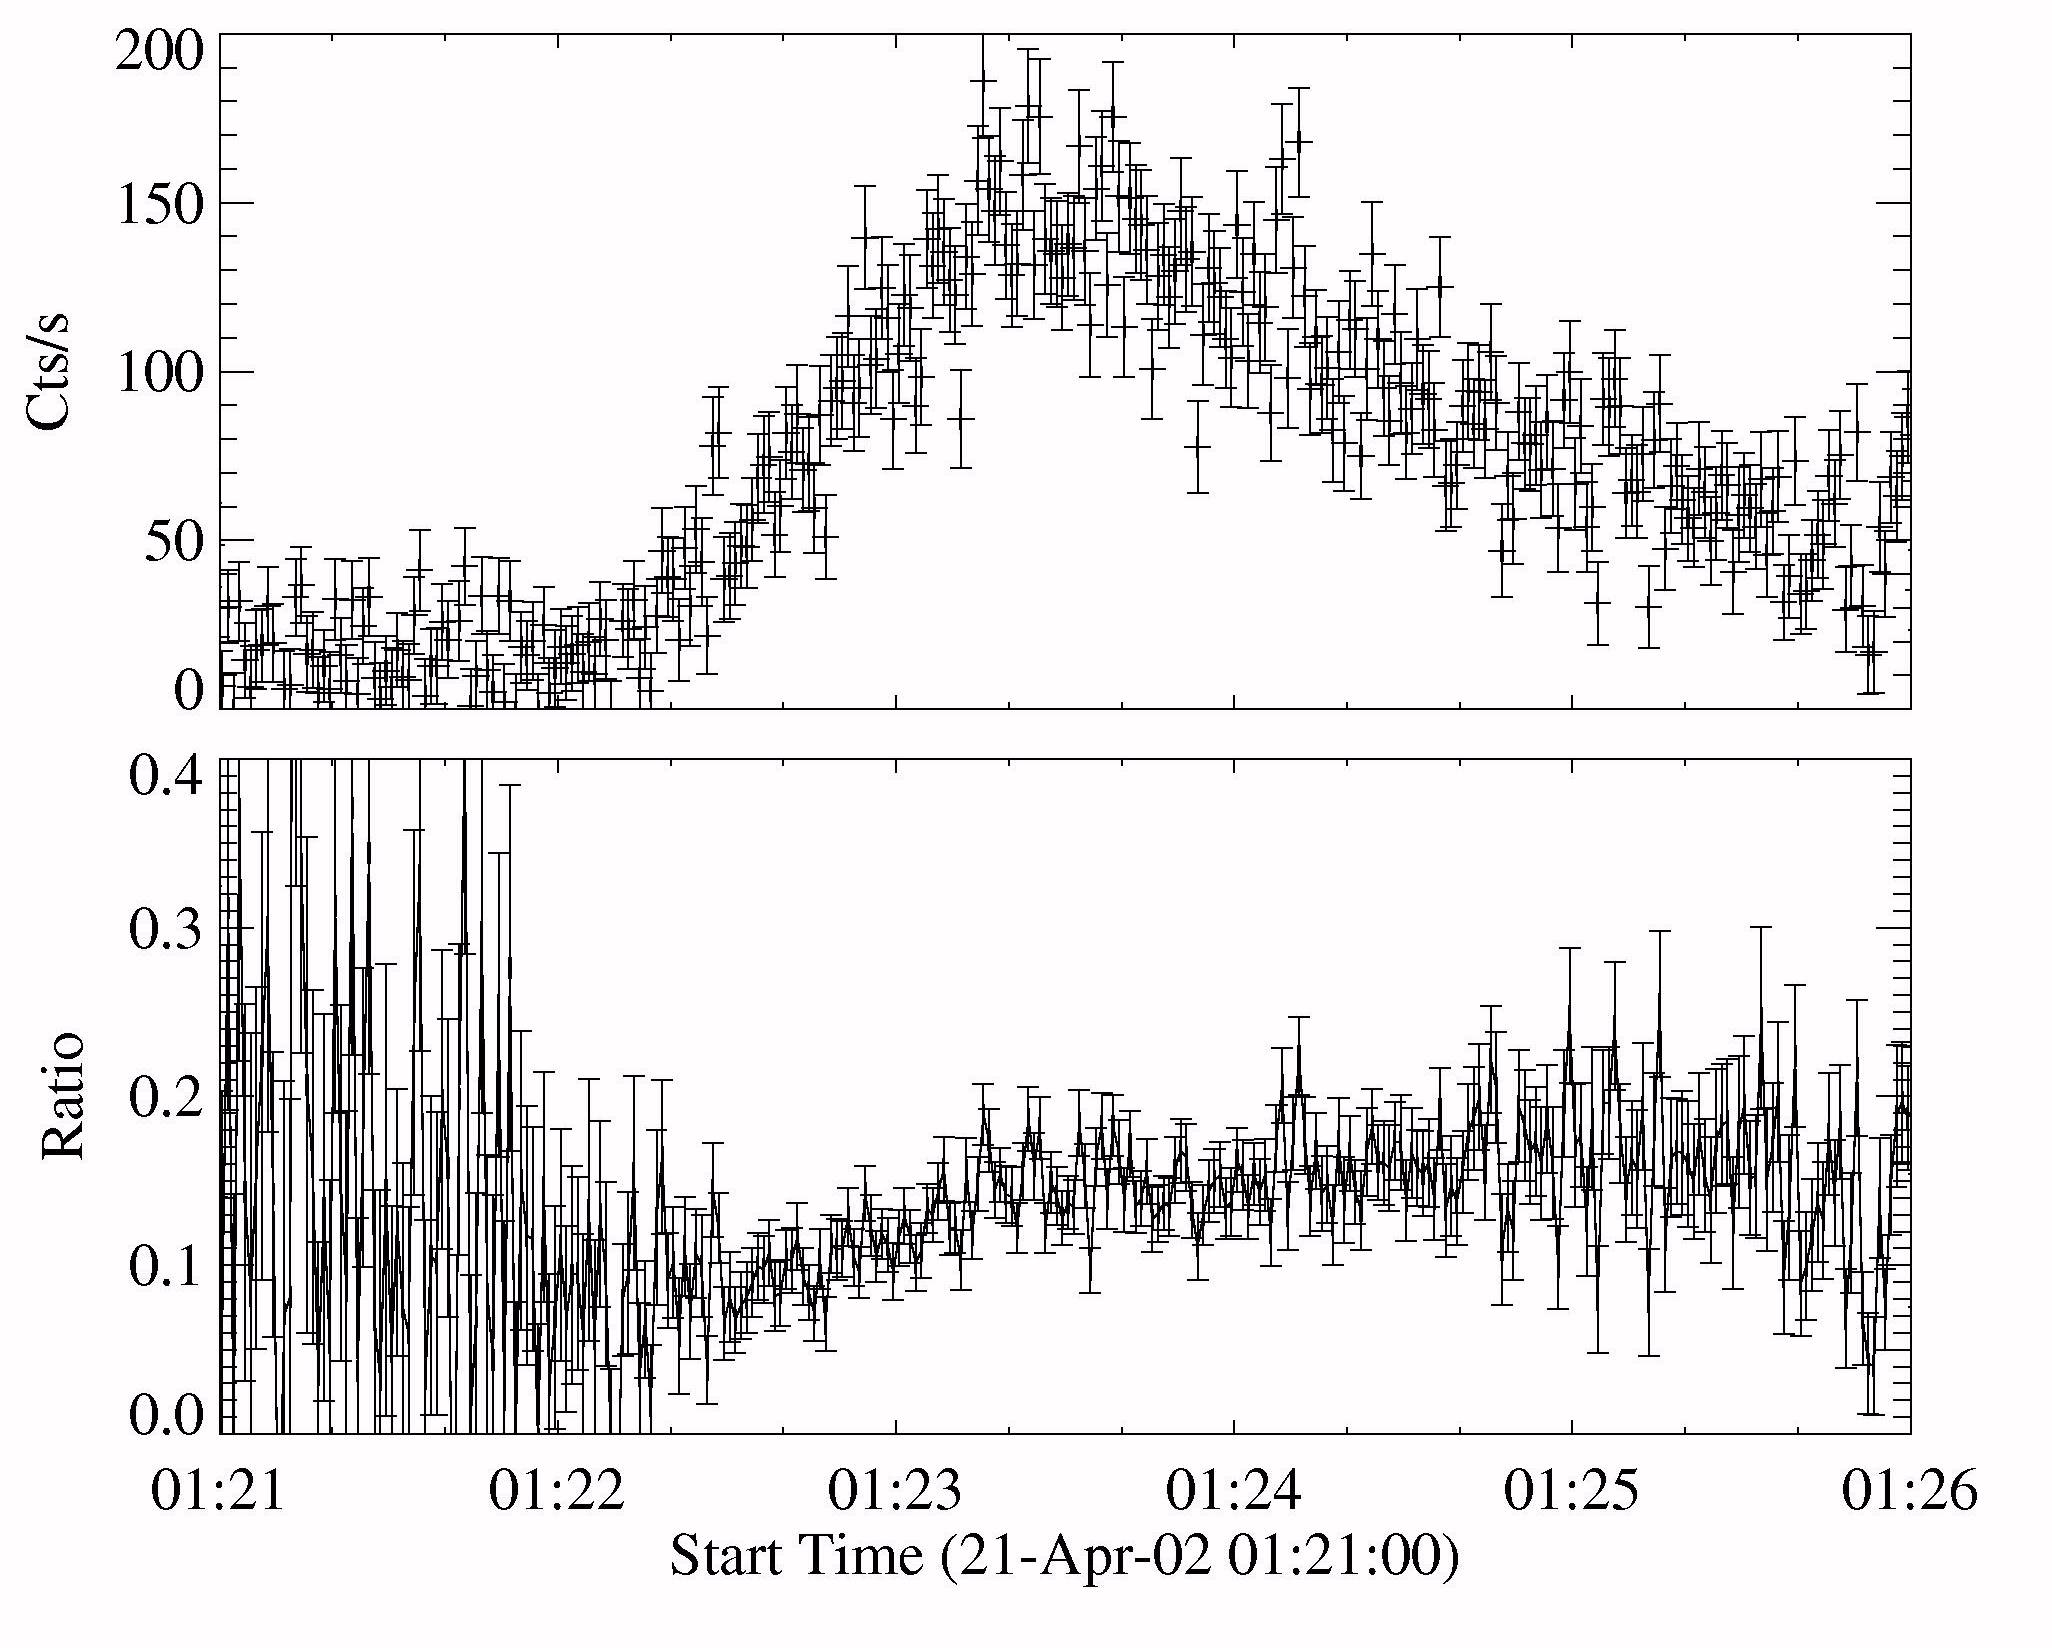
| 21:53, 31 October 2008 | RHESSI_countrate_21042002.jpg (file) | Schriste | 358 KB | (RHESSI 100-200 keV counting rate (top panel) and 100 – 200 keV/50 – 100 keV hardness ratio (bottom panel) for the second peak of the 2002 April 21 solar flare.) | 1 |
| 22:24, 4 November 2008 | Icon_86.jpg (file) | Schriste | 28 KB | 1 | |
| 11:03, 5 November 2008 | Icon_85.jpg (file) | Hhudson | 2 KB | (Sobel-filtered white-light image constructed from one month's worth of RHESSI aspect-camera data.) | 1 |
| 11:07, 5 November 2008 | Icon_84.jpg (file) | Hhudson | 12 KB | (A view of MESSENGER's accommodation of the X-ray Spectrometer instrument.) | 2 |
| 13:14, 5 November 2008 | Icon_83.jpg (file) | Hhudson | 5 KB | 1 | |
| 13:17, 5 November 2008 | Icon_82.jpg (file) | Hhudson | 5 KB | 1 | |
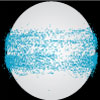
| 13:21, 5 November 2008 | Icon_81.jpg (file) | Hhudson | 4 KB | (Solar centroid locations of thousands of X-ray microflares observed by RHESSI. ) | 1 |
| 11:14, 12 November 2008 | Icon_80.jpg (file) | Hhudson | 2 KB | (Gauguin's view of the McClymont Jerk) | 1 |
| 15:45, 13 November 2008 | Electron_Spectrum_for_01Apr2004.png (file) | Schriste | 50 KB | (Plot of electron distribution spectrum for the 1 April 2004 23:00 UTC solar flare. The blue line denotes the uncorrected electron spectrum and the green line denotes the electron spectrum after correction for albedo. Both lines are plotted with 1σ error ) | 1 |
| 15:48, 13 November 2008 | Histogram_of_dip_as_function_of_heliocentric_angle.png (file) | Schriste | 25 KB | (Histogram of the 18 events with a significant dip as a function of μ, the cosine of the heliocentric angle of the flare.) | 1 |
| 15:50, 13 November 2008 | Histogram_of_dip_as_function_of_index.png (file) | Schriste | 32 KB | (Histogram showing the percentage of flares with a dip as a function of spectral index γ ) | 1 |
| 20:55, 17 November 2008 | Icon89.png (file) | Schriste | 45 KB | (Arthur Compton holding the dip.) | 1 |
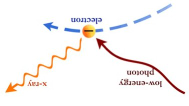
| 17:42, 24 November 2008 | Invsersecompton.jpg (file) | Pmallik | 10 KB | 1 | |
| 17:43, 24 November 2008 | Inversecompton.jpg (file) | Pmallik | 10 KB | 1 | |
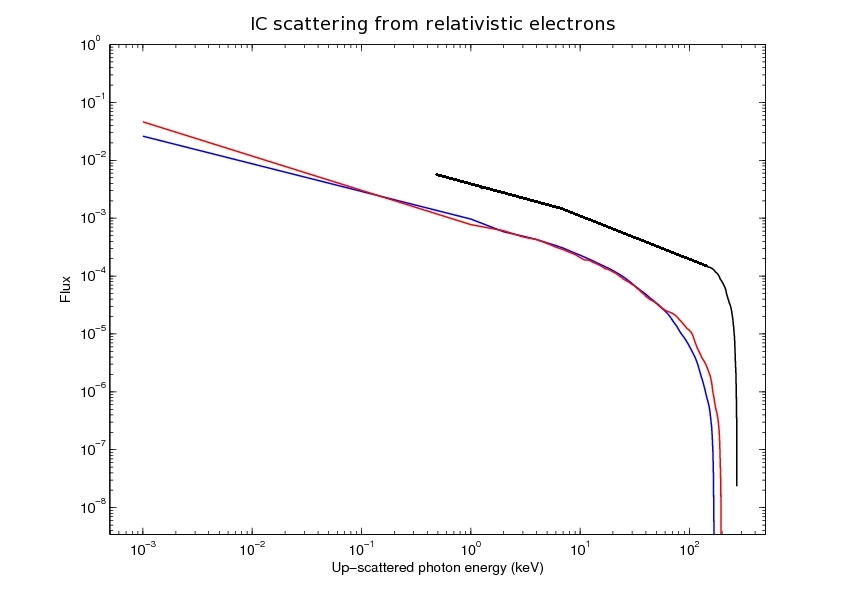
| 18:13, 24 November 2008 | ICelec.jpg (file) | Pmallik | 65 KB | 2 | |
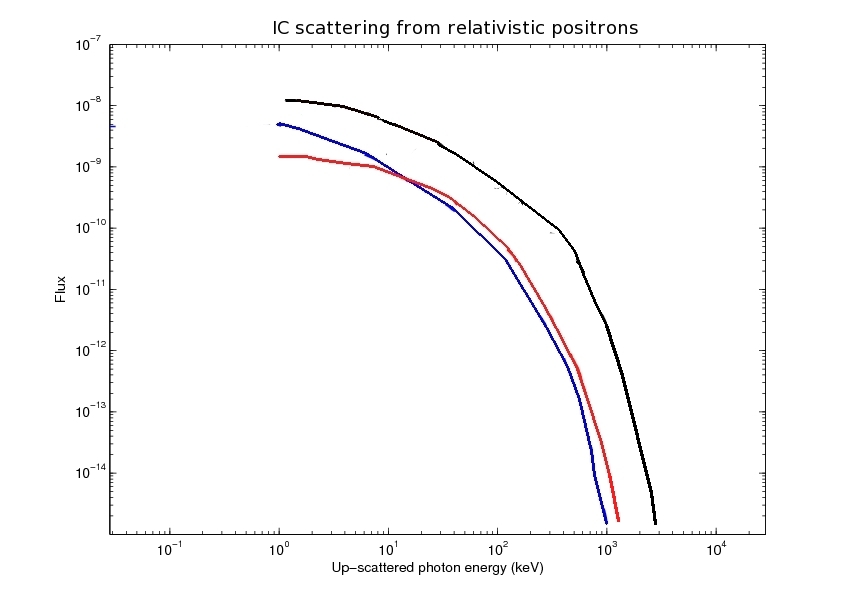
| 18:18, 24 November 2008 | ICposi.jpg (file) | Pmallik | 71 KB | 2 | |
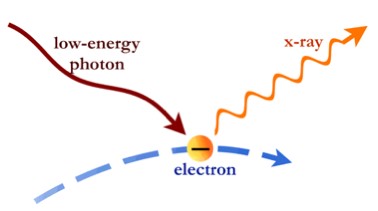
| 17:05, 1 December 2008 | Icon90.png (file) | Hhudson | 13 KB | (Inverse Compton scattering is really the same thing as regular Compton scattering, from the physicist's point of view) | 1 |
| 17:57, 1 December 2008 | Icon90.jpg (file) | Schriste | 39 KB | (Arthur Compton in inverse.) | 1 |
| 17:32, 10 December 2008 | Solar_Cycle_24_Poster.jpg (file) | Schriste | 217 KB | (Meeting poster for the Solar Cycle 24 meeting in Napa.) | 1 |
| 14:07, 22 December 2008 | Solar24.jpg (file) | Hhudson | 98 KB | (Variation of the radio index [http://www.hia-iha.nrc-cnrc.gc.ca/drao/solar_e.html F10.7] over its recorded history, which began in 1947. As a crude measure of cycle length, this plot locates each cycle by noting when this index passes through 80 SFU (one ) | 1 |
| 15:06, 22 December 2008 | Icon91.jpg (file) | Hhudson | 23 KB | 1 | |
| 18:28, 22 December 2008 | Sunspot_Numbers.png (file) | Schriste | 42 KB | (This figure summarizes the 400 years of regular sunspot number observations. This figure was prepared by Robert A. Rohde and is part of the Global Warming Art project.) | 1 |
| 20:29, 22 December 2008 | Solar_Cycle_24_Schedule.jpg (file) | Schriste | 318 KB | (Layout of the working groups at the Solar24 meeting. ) | 1 |
| 01:53, 23 December 2008 | Icon91.png (file) | Schriste | 6 KB | 1 | |
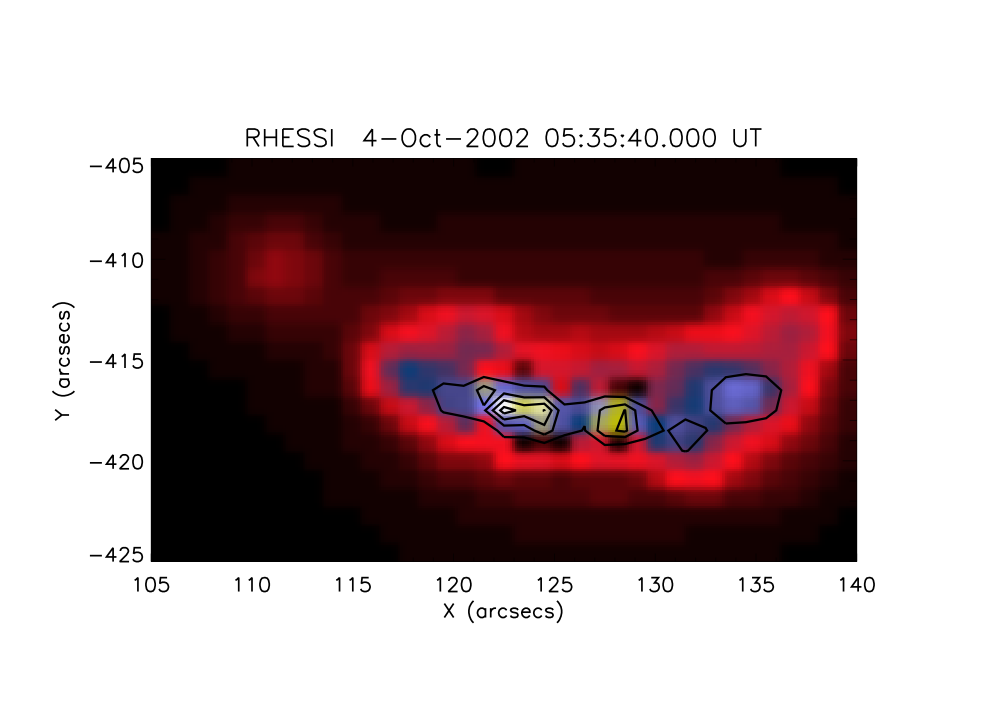
| 20:37, 5 January 2009 | Wlmodel2.png (file) | Lfletcher | 285 KB | (TRACE WL image at the peak of the 4-Oct-2002 flare) | 1 |
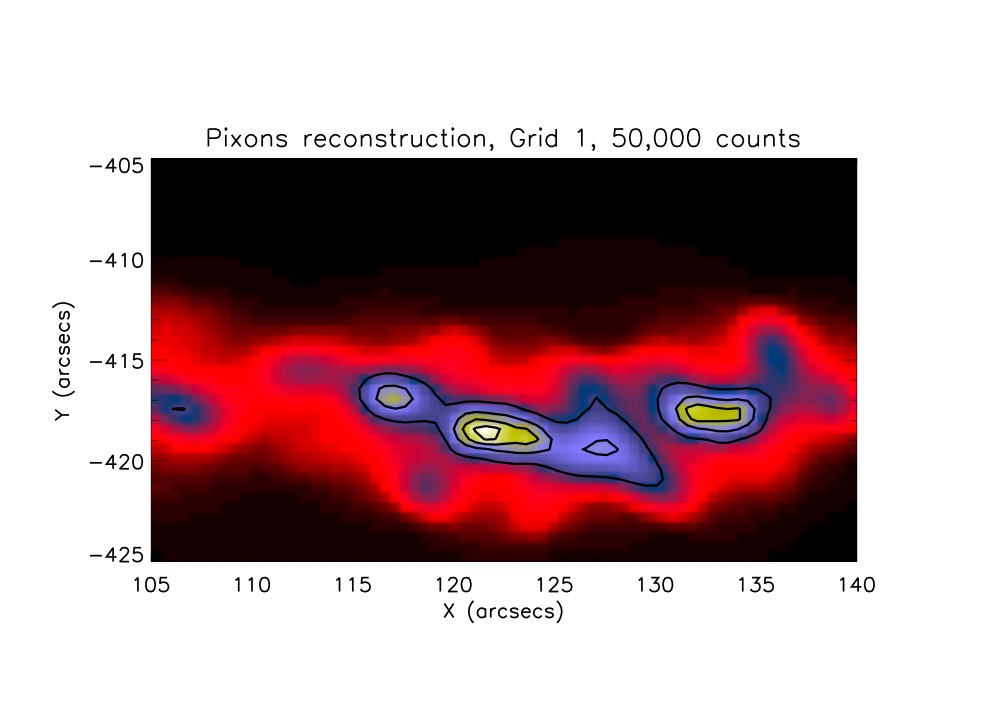
| 20:51, 5 January 2009 | Pixons_041002.png (file) | Lfletcher | 107 KB | (RHESSI image of the 4-October-2008 event, made with grids 1,3,4,5,6 between 25-50keV. The Pixons algorithm was used.) | 1 |
| 21:08, 5 January 2009 | Wlrecon_1ppp.jpg (file) | Lfletcher | 76 KB | (Pixons reconstruction of the model flare based on a WL image, simulating using grids 1,3,4,5,6 and a pixel size of 0.5 arcsec) | 1 |
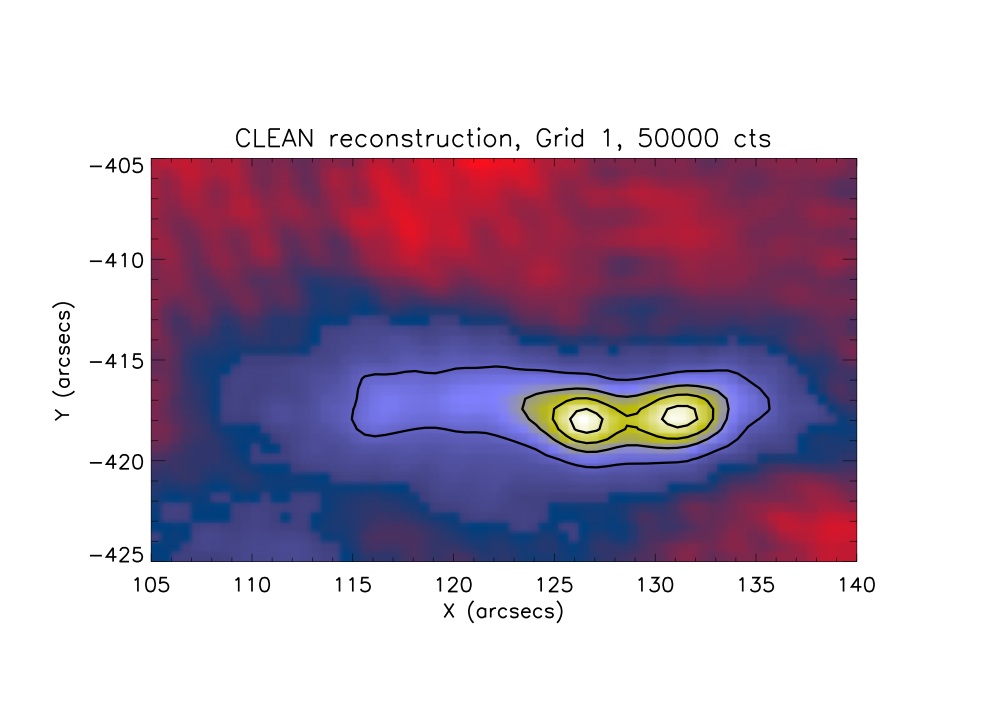
| 21:28, 5 January 2009 | Wlrecon_1_50000.jpg (file) | Lfletcher | 82 KB | (CLEAN reconstruction of the WL model flare using grids 1,3,4,5,6) | 1 |
| 03:36, 6 January 2009 | Icon92.jpg (file) | Schriste | 5 KB | 1 |
First page |
Previous page |
Next page |
Last page |