The Greatest GOES Flares
From RHESSI Wiki
(→The GOES soft X-rays) |
(→The GOES soft X-rays) |
||
| Line 57: | Line 57: | ||
magnitudes. | magnitudes. | ||
Our analysis also involves an algorithmic background subtraction for each event, at the full | Our analysis also involves an algorithmic background subtraction for each event, at the full | ||
| - | time resolution of the data | + | time resolution of the data. |
| - | which are based on 1-minute averaging and no background corrections. | + | The peak fluxes estimated this way cannot be exactly compared with the NOAA classes, |
| - | The red line shows a fit to | + | which are based on 1-minute averaging and no background corrections, but for the |
| + | greatest events there is usually little difference. | ||
| + | The red line shows a fit to an assumed linear part of the distribution function, based on the | ||
[https://en.wikipedia.org/wiki/Maximum_likelihood_estimation maximum-likelihood] | [https://en.wikipedia.org/wiki/Maximum_likelihood_estimation maximum-likelihood] | ||
algorithm. | algorithm. | ||
Revision as of 14:12, 8 October 2023
| Nugget | |
|---|---|
| Number: | 456 |
| 1st Author: | Hugh HUDSON |
| 2nd Author: | Ed CLIVER |
| Published: | September 25, 2023 |
| Next Nugget: | TBD |
| Previous Nugget: | Introducing SunSketcher |
| List all | |
Contents |
Background
Solar flares appear as isolated bursts of soft X-rays, and powerful ones are distinctly less frequent than weaker ones. In this property they share the power-law occurrence character of earthquakes and many other natural (and man-made) phenomena. In the case of the Sun, this power law is so "flat" that, if extrapolated up into the domain of infrequent but powerful events, the total energy required appears to be infinite. This cannot be! See an earlier Nugget on this issue. Accordingly it was reassuring when Ref. [1] surveyed solar radio bursts and suggested an upper limit to the power law, which otherwise is scale-free.
The GOES soft X-rays
Since the 1970s there have been systematic observations of the solar soft X-ray flux, which varies continuously and shows flare activity very well. Indeed, estimates suggest that a solar flare devotes several percent of its total energy release in just the standard GOES 1-8 Å spectral band. Other estimates suggest that a similar fraction goes into MeV "solar cosmic rays", meaning that the flare process is wildly non-thermal in its nature.
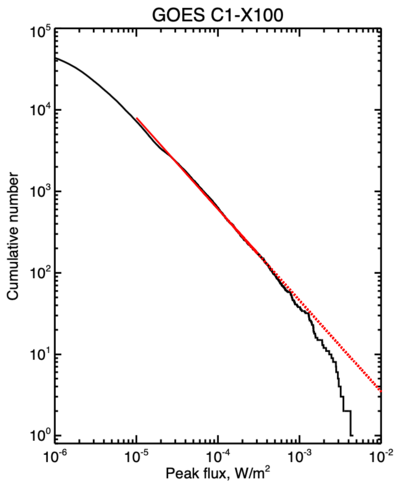
Do the soft X-ray bursts, a relatively close proxy for total flare energy, truly follow the flat power law that we're familiar with? The answer to this question is hidden in a dozen GOES events that "saturated" their X-ray flux estimations. In Ref. [2] we have now analyzed these events systematically, as shown for test examples in Figure 1. We applied the same techniques to the 12 saturated events in the database and believe that the estimates of their peak fluxes thus derived have uncertainties well within the absolute calibrations of the GOES measurements.
We can now present a complete occurrence distribution function (Figure 2), based on our new estimates of peak soft X-ray fluxes interpreted as equivalent GOES classes. This is the downward cumulative distribution function, showing a deviation from a simple power law for the greatest events, now including the 12 saturated events at their estimated magnitudes. Our analysis also involves an algorithmic background subtraction for each event, at the full time resolution of the data. The peak fluxes estimated this way cannot be exactly compared with the NOAA classes, which are based on 1-minute averaging and no background corrections, but for the greatest events there is usually little difference. The red line shows a fit to an assumed linear part of the distribution function, based on the maximum-likelihood algorithm. The power law has an index of -2.0, within uncertainties, consistent with other studies of this database. We chose the M1-X3 range here to avoid overlapping small events. Note that the SXR peak fluxes include NOAA’s recently established correction factor (1.43) to adjust the GOES-1 through GOES-15 data covering 1975-2016.

Conclusions
The turn-over we see, if it scales with total event energy or other manifestations, suggests that extreme events may be less probable than previously thought. In particular the remarkable tree-ring radioisotope events (Ref. [2]) seem less consistent with our current understanding of the physics of solar flares. This is also an interesting development for "superflares" on other stars. However our understanding of the physics is sufficiently weak that eventually a common theoretical basis for solar flare, solar extreme events, and stellar superflares may develop.
Acknowledgements
The authors of Ref. [2] and this Nugget include Stephen WHITE, Janet MACHOL, Courtney PECK, Kim TOLBERT, Rodney VIERECK, and Dominic ZARRO.
References
[1] "The Peak Flux Distribution of Solar Radio Bursts"
[2] Submitted to Solar Physics
[3] "A signature of cosmic-ray increase in AD 774-775 from tree rings in Japan"
| RHESSI Nugget Date | 25 September 2023 + |
| RHESSI Nugget First Author | Hugh HUDSON + |
| RHESSI Nugget Index | 456 + |
| RHESSI Nugget Second Author | Ed CLIVER + |
