User talk:Bdennis
From RHESSI Wiki
| Nugget | |
|---|---|
| Number: | ??? |
| 1st Author: | Brian Dennis |
| 2nd Author: | and Kim Tolbert |
| Published: | ??? |
| Next Nugget: | ??? |
| Previous Nugget: | ??? |
| List all | |
Contents |
Introduction
Every Geostationary Operational Environmental Satellite (GOES) since 1976 has carried an X-Ray Sensor (XRS) consisting of a pair of ion chambers to measure the total solar flux in two wavelength bands, 0.5 - 4 and 1 - 8 Angstroms. These measurements recorded every 3 s (2 s since GOES 13 was launched in 2010) have been extremely valuable in providing a largely uninterrupted record of solar activity over the last 40 years. The absolute sensitivities of the instruments on the different spacecraft have been kept remarkably constant and the ABCMX flare classification scheme is widely used to this day. A use-friendly IDL GOES Workbench is available to plot the light curves for any time interval with or without background subtraction. The temperature and emission measure of the emitting flare plasma can also be readily estimated from the two-channel measurements assuming that the emitting plasma is all at the same temperature and has coronal abundances (Ref. [1]).
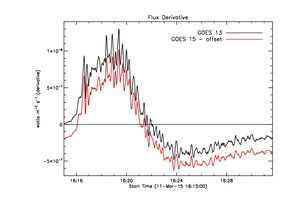
Initially, it was thought that the soft X-ray light curves as measured by GOES XRS were not particularly informative. The typical light curve rises relatively slowly during the impulsive phase seen in hard X-rays or microwaves. After reaching a peak near the end of the impulsive phase, it falls roughly exponentially with a somewhat longer time scale than on the rise. Neupert (1968, ApJ, 153, 59) had noted that the soft X-ray rise was comparable to the time integral of the microwave flux and Dennis and Zarro (1992, Sol. Phys. 146, 177) showed that a similar relation existed with hard X-rays for some flares. This relationship can be best visualized by displaying the time derivative of the soft X-ray light curve, and this has been used as a proxy for the hard X-ray or microwave light curves when they are not available. The common explanation is that the hard X-rays and microwaves are generated by electrons accelerated during the impulsive phase to 10s - 100s of keV and that these same electrons heat plasma to temperatures of ~10 to 50 MK that then radiates in soft X-rays. Since the heating can be very rapid on timescales of seconds or less while the plasma cooling time is likely to be much longer, the amount of hot plasma accumulates with time during the impulsive phase and hence is proportional to the time integral of the number of accelerated electrons (Ref [3]).
carries a solar X-ray package (the “X-Ray Sensor”, or XRS) consisting of a collimator that feeds a pair of ion chambers. These ion chambers measure the Sun’s spatially integrated soft X-ray flux in two wavelength bands, 0.5–4 and 1–8 with a 3-s cadence. The GOES soft X-ray detectors have provided an essentially uninterrupted monitor of the Sun’s activity for 30 years, and are a valuable re- source for the study of past solar activity and the prediction of space weather (e.g., Bornmann, 1990; Phillips and Feldman, 1995; Aschwanden and Alexander, 2001; Garcia, 2004). For quantitative physical understanding of processes in the Sun’s atmosphere,
˚ A,
Heading 1
Figure 1 shows the GOES light curve for the X-class flare on 23 July 2002
The right panel of Figure 1 shows .
Heading 2
Conclusion
Small features in the GOES light curves are real even well into the decay phase of the flare.


