Weekly Report 22Apr2011
From RHESSI Wiki
(Difference between revisions)
(→RHESSI Albedo Image Test) |
(→RHESSI Albedo Image Test) |
||
| Line 2: | Line 2: | ||
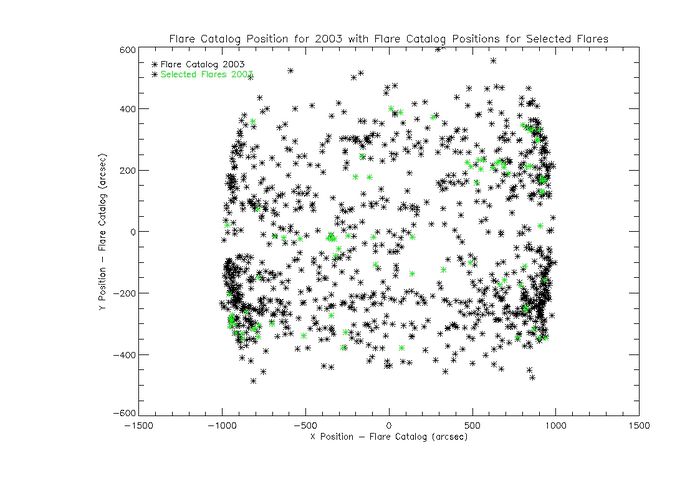
| - | [[File:Flare cat positions.jpg|center|thumb|700px|]] | + | [[File:Flare cat positions.jpg|center|thumb|700px|The plot shows the position of all flares on the disk that meet the threshold flux criteria along with those selected for the study.]] |
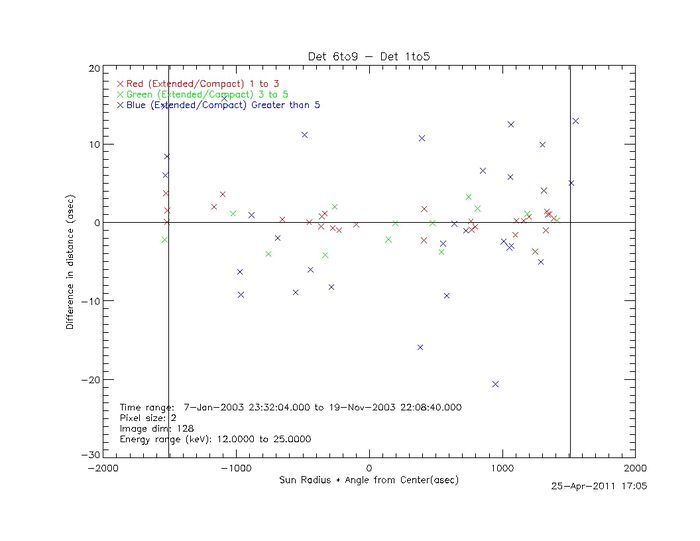
| - | [[File:Diffcent 12to25 det6to9 det1to5.jpg|center|thumb|700px|]] | + | [[File:Diffcent 12to25 det6to9 det1to5.jpg|center|thumb|700px|The difference in centroid location for images created using detectors 6 to 9 versus detectors 1 to 5.]] |
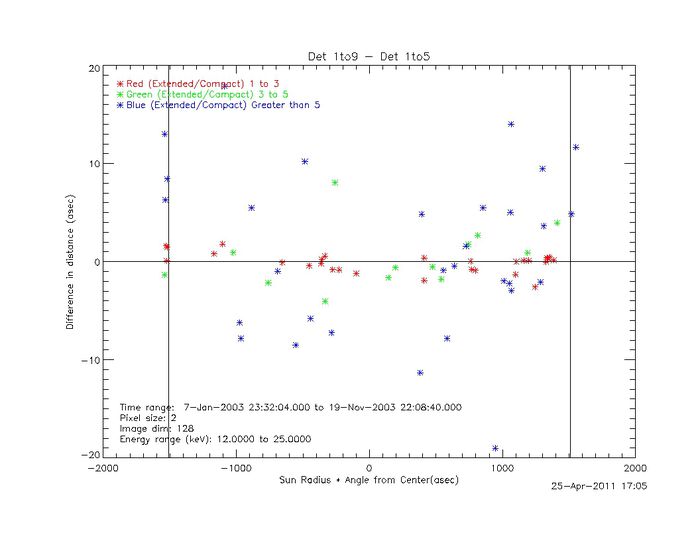
| - | [[File:Diffcent 12to25 det1to9 det1to5.jpg|center|thumb|700px|]] | + | [[File:Diffcent 12to25 det1to9 det1to5.jpg|center|thumb|700px|The difference in centroid location for images created using detectors 1 to 9 versus detectors 1 to 5.]] |
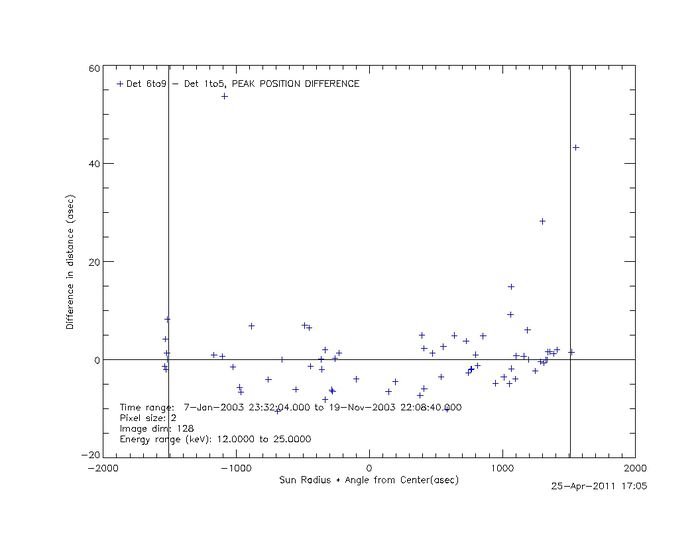
| - | [[File:Peak pos diff.jpg|center|thumb|700px|]] | + | [[File:Peak pos diff.jpg|center|thumb|700px|The difference in peak position for images created using detectors 6 to 9 minus detectors 1 to 5.]] |
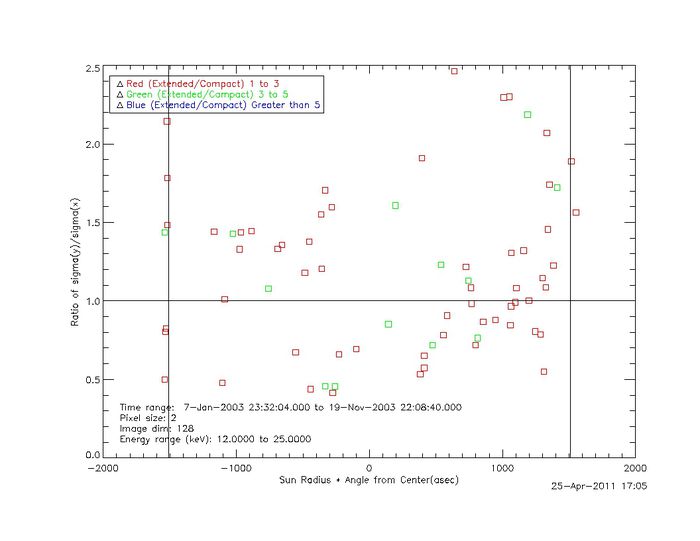
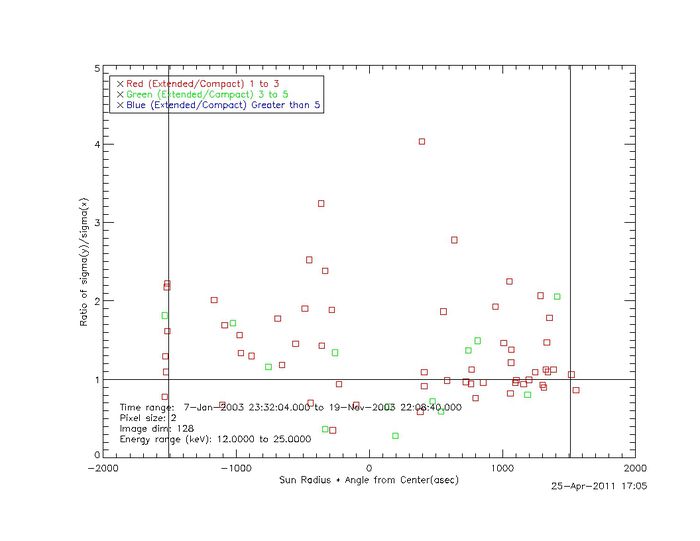
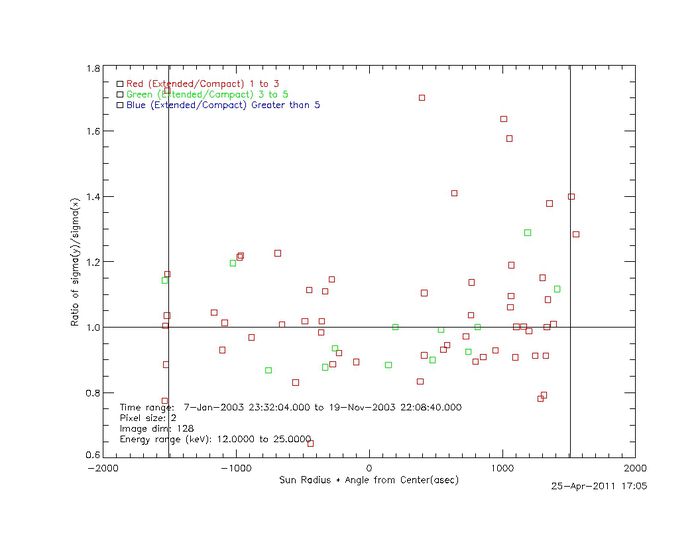
| - | [[File:Ratio stdev det1to9 new.jpg|center|thumb|700px|]] | + | [[File:Ratio stdev det1to9 new.jpg|center|thumb|700px|The ratio of the standard deviation in y over the standard deviation in x for images created using all detectors.]] |
| - | [[File:Ratio stdev det1to5 new.jpg|center|thumb|700px|]] | + | [[File:Ratio stdev det1to5 new.jpg|center|thumb|700px|The ratio of the standard deviation in y over the standard deviation in x for images created using detectors 1 to 5.]] |
| - | [[File:Ratio stdev det6to9 new.jpg |center|thumb|700px|]] | + | [[File:Ratio stdev det6to9 new.jpg |center|thumb|700px|The ratio of the standard deviation in y over the standard deviation in x for images created using detectors 6 to 9.]] |
Revision as of 23:46, 25 April 2011
RHESSI Albedo Image Test
