Weekly Report 22Apr2011
From RHESSI Wiki
(→RHESSI Albedo Image Test) |
(→RHESSI Albedo Image Test) |
||
| Line 16: | Line 16: | ||
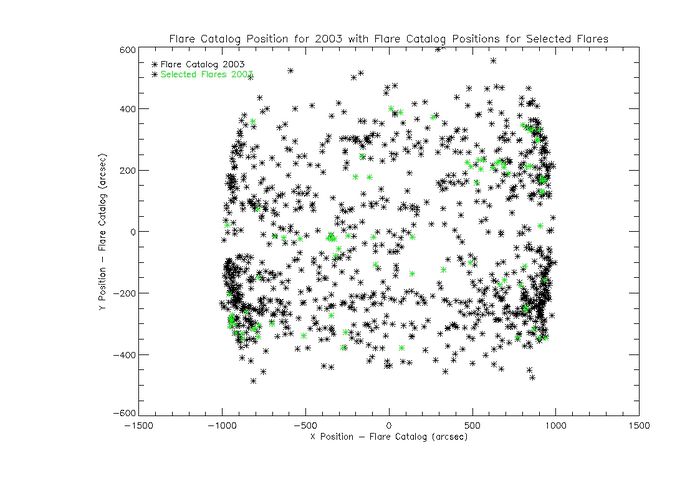
The plot below shows the actual flare position of all flares which reached the minimum flux value required in black. The flares which were actually selected are in green. These met additional criteria for the flux in the 35keV to 50 keV energy band. | The plot below shows the actual flare position of all flares which reached the minimum flux value required in black. The flares which were actually selected are in green. These met additional criteria for the flux in the 35keV to 50 keV energy band. | ||
[[File:Flare cat positions.jpg|center|thumb|700px|The plot shows the position of all flares on the disk that meet the threshold flux criteria along with those selected for the study.]] | [[File:Flare cat positions.jpg|center|thumb|700px|The plot shows the position of all flares on the disk that meet the threshold flux criteria along with those selected for the study.]] | ||
| - | The plot shows that there were more flares selected in the positive heliocentric positive x hemisphere. | + | The plot shows that there were more flares selected in the positive heliocentric positive x hemisphere, however the numbers were not as many as appeared in the earlier analysis. This plot led to the issues discovered. |
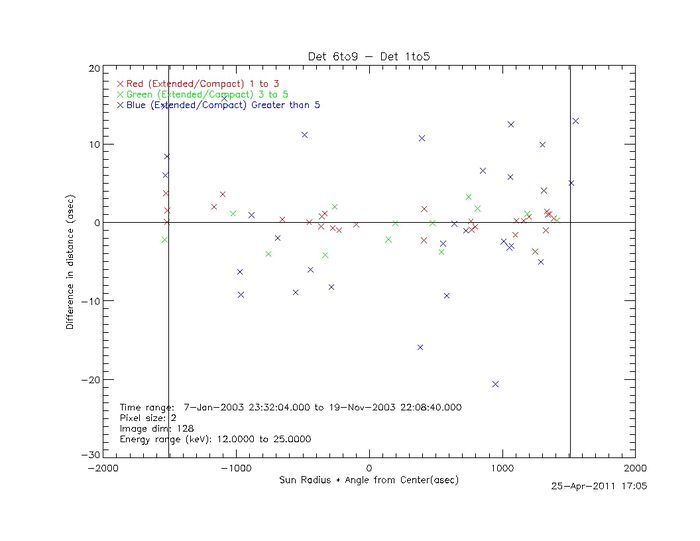
| + | The plot below shows the difference in the centroids for images made with detector 6 to 9 minus detectors 1 to 5. This shows the displacement of the extended source with respect to the compact source. | ||
[[File:Diffcent 12to25 det6to9 det1to5.jpg|center|thumb|700px|The difference in centroid location for images created using detectors 6 to 9 versus detectors 1 to 5.]] | [[File:Diffcent 12to25 det6to9 det1to5.jpg|center|thumb|700px|The difference in centroid location for images created using detectors 6 to 9 versus detectors 1 to 5.]] | ||
| + | The plot shows that the distribution of flares around the center are about 40% in the negative heliocentric X hemisphere compared to about 60% in the positive. The points which show are a difference of larger than 10 arcsec are being looked at more closely. | ||
Revision as of 03:42, 26 April 2011
RHESSI Albedo Image Test
RHESSI Clean Imaging techniques were used to image a large number of flares. For each flare three different detector combinations and two different energy bands were used. The following parameters were used: The flares used were decided upon by the RHESSI response in the 25keV-50keV bands.
- Time: Decided by the peak of the 25keV-50keV energy band for each flare
- Energy: 12keV to 25keV, or 25keV to 50keV
- Detectors: 1 to 9, or 1 to 5,or 6 to 9
- Pixel Size: 2 arcsec by 2 arcsec
- Image Size: 128 pixels by 128 pixels
- Clean Beam Width Factor = 2
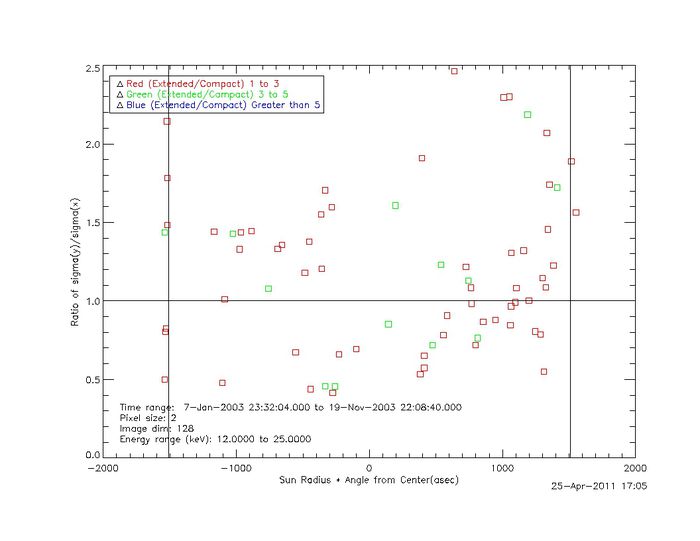
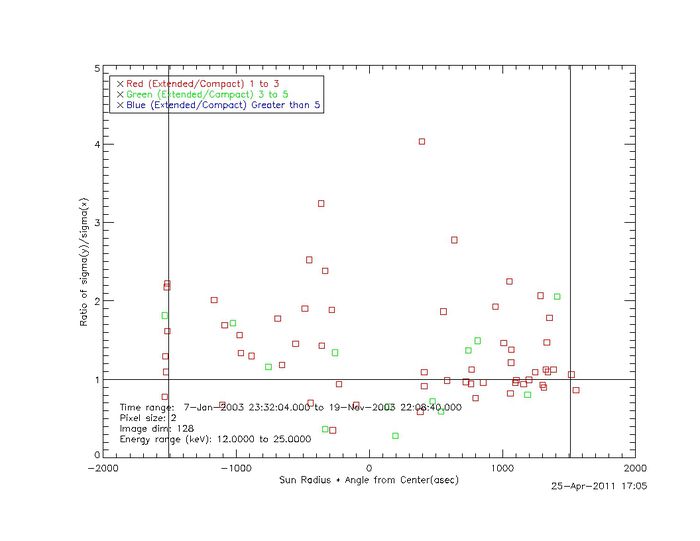
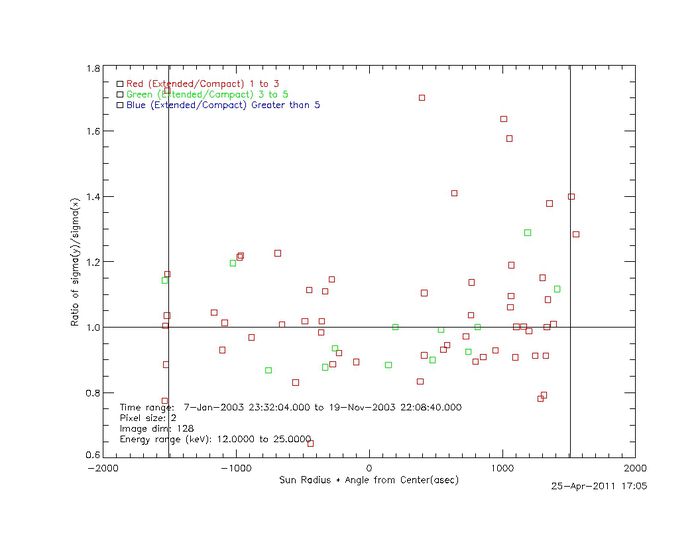
Clean images were made with each for each energy band with each detector combination. For each image the centroid of the source was measured, the total flux in the image was measured, and the standard deviation in the x and y direction for each source was measured. Using these measurements the plots below were made.
The new analysis below was done because of the last set of data analysis showed an asymmetry in the distribution of flares. One third of the flares were in the negative heliocentric x hemisphere with two thirds in the heliocentric y hemisphere. This turned out to be an analysis issue with the selection of the heliocentric X position. The selections were done using all detector combinations instead of thee position for the flare. This lead to discrepancies in the flare position.
The plot below shows the actual flare position of all flares which reached the minimum flux value required in black. The flares which were actually selected are in green. These met additional criteria for the flux in the 35keV to 50 keV energy band.
The plot shows that there were more flares selected in the positive heliocentric positive x hemisphere, however the numbers were not as many as appeared in the earlier analysis. This plot led to the issues discovered.
The plot below shows the difference in the centroids for images made with detector 6 to 9 minus detectors 1 to 5. This shows the displacement of the extended source with respect to the compact source.
The plot shows that the distribution of flares around the center are about 40% in the negative heliocentric X hemisphere compared to about 60% in the positive. The points which show are a difference of larger than 10 arcsec are being looked at more closely.
