The Balmer continuum observed from IRIS!
From RHESSI Wiki
| Nugget | |
|---|---|
| Number: | 237 |
| 1st Author: | Petr Heinzel |
| 2nd Author: | Lucia Kleint |
| Published: | September 29, 2014 |
| Next Nugget: | Kappa Distributions |
| Previous Nugget: | Poynting flux |
| List all | |
Contents |
Introduction
White light flares (WLF) have been known since R.C. Carrington observed very bright emission on the Sun in 1859 during a large flare. We now know that visible continuum emission from a flare has a close association with the hard X-ray signatures, and shows us the dominant flare energy.
Recently, it was found that white light flares are quite common, and even small flares may show increases in the continuum emission. Two mechanisms for WLFs are currently considered to be responsible for this optical emission [Ref. 1]: (i) photospheric continuum enhancement as a signature of the temperature increase around and below the temperature minimum region (mainly the H- continuum), and (ii) hydrogen recombination continua (Paschen, Balmer) produced in the chromosphere. The radiation in the latter continua emitted upwards should be directly detectable, while the downward component could heat the photosphere, the so-called 'back-warming' effect [Ref. 2]. When high-energy electrons, whose signature is clearly detected in hard X-rays by RHESSI, appear at chromospheric densities, impulsive plasma heating takes place. This leads to strong ionization of hydrogen and of metals. Since the ionizing particles do not come from the ambient distribution, but have higher energies, we call this process non-thermal ionization. As a result of this, but mainly from normal thermal collisions, the chromospheric electron density abruptly increases. Subsequent radiative recombination back to neutral hydrogen produces radiation in hydrogen continua, of which the Paschen continuum dominates most of the visible spectral range (the WLF), with the Balmer continuum appearing shortward of 3646Å. In particular, the stronger Balmer continuum could be energetically more important, and therefore its flare signatures have been sought for decades. Close to the Balmer jump (3646Å), some ground-based observations have suggested the presence of this continuum, up to an enhancement 200%, but the observations this far out in the UV are difficult from ground.
Now with the launch of the IRIS spacecraft more than a year ago, we have an opportunity to observe spectra around 2800Å, in the near UV wavelengths. This makes it possible to search for the Balmer continuum during flares, with high spatial and temporal resolution. In terms of energy, the temperature of a normal chromosphere corresponds to about 1 eV, the Balmer edge to 3.4 eV, and the IRIS observation to 4.4 eV.
Continuum Enhancement during the X1 flare SOL2014-03-29
Inspecting the existing IRIS flare spectra, we found a clear enhancement of the continuum intensity during the X1 flare SOL2014-03-29, shown in Figure 1 [Ref. 3]. The icon for this Nugget shows HMI's view of the visible continuum (the actual white-light flare), displaying the classical two-ribbon configuration. Note that an earlier Nugget described the amazing breadth of observational material available for this flare.
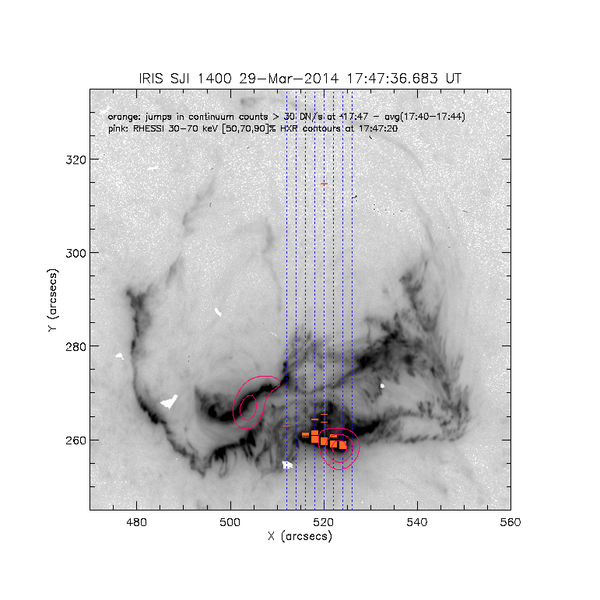
A bright band of emission is visible throughout the whole IRIS spectrum in four spectral windows. The magnified image on the top right shows this more clearly. We determined where the continuum increased by more than 30 counts per second and plotted these locations as orange lines in Figure 2.
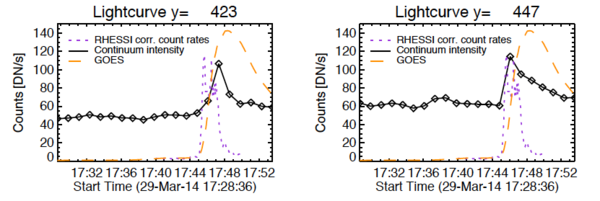
They coincide well with the flare ribbons and seemingly also with the RHESSI hard X-ray positions, although this remains to be explored in detail. To actually see if the continuum emission is really flare-related, we need to plot its temporal evolution. Figure 3 shows the light curves for two of the positions marked in Figure 1.
The continuum changes are clearly related to the flare timing (indicated as GOES and RHESSI count rates in arbitrary units). Locations in the quiet Sun, or at other bright regions do not change during the flare. In summary, the continuum may increase generally up to 200% in the NUV, similarly to previous findings close to the Balmer jump. The difference between flare and quiet-Sun spectra clearly shows an enhancement which is constant over the observed wavelength range from 2813Å to 2834Å, indicating the presence of optically-thin continuum emission from the chromosphere which is added on top of the already-present MgII line wing from the photosphere.
Conclusions
This observation has shown that IRIS can detect continuum enhancements in the NUV window and a quick check of another flare, the X1.6 one on Sep 10, 2014, shows a similar enhancement indicating that the continuum changes are a common frequent phenomenon. We interpret this enhancement as the Balmer-continuum emission during the impulsive phase of the flare. Quantitatively this is consistent with the existing models of the electron energy deposit in the lower solar atmosphere. Future modeling, specifically the radiation-hydrodynamical simulations, will show how much electron energy is required for such an enhancement. Input beam energies can be derived from the RHESSI spectra and simulations will predict the Balmer-continuum emission, but also possible photospheric continuum enhancement due to the back-warming effect. The IRIS NUV window is thus very promising for future flare research, providing a unique continuum diagnostics of the beam precipitation.
References
[1] "The Origin of Solar White-Light Flares"
[2] "Radiative Backwarming in White-Light Flares"
| RHESSI Nugget Date | 29 September 2014 + |
| RHESSI Nugget First Author | Petr Heinzel + |
| RHESSI Nugget Index | 237 + |
| RHESSI Nugget Second Author | Lucia Kleint + |


