The Fastest Flare
From RHESSI Wiki
| Nugget | |
|---|---|
| Number: | 256 |
| 1st Author: | Hugh Hudson |
| 2nd Author: | Paulo Simões |
| Published: | 29 June 2015 |
| Next Nugget: | Galactic cosmic rays near the Sun |
| Previous Nugget: | Electrons and Currents |
| List all | |
Contents |
Introduction
Solar soft X-ray observations show flare activity extremely well, but typically have slower time variations than the hard X-rays. Recent improvements to the standard GOES/XRS data now make it possible, though to take advantage of the Neupert effect to provide a proxy for the presence of the fast electrons (above 10 keV) that RHESSI detects.
Within the last week an extraordinarily fast GOES event happened (a burst within SOL2015-06-20T02:36, C2.3; for reference see also our earlier Nugget The Slowest Flare). We have checked, as described below, finding this to in fact have been the very fastest GOES burst for the entire month, 25-May through 24-June. What did this striking event look like? In particular, could there have been a true impulsive-phase signature (non-thermal bremsstrahlung) from the fast electrons, detected by the GOES photometers? If so, that would be a remarkable first.
The Log Derivative
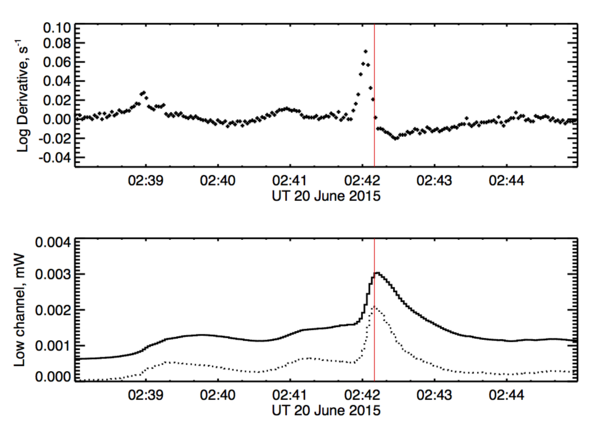
The modern GOES data have sufficient signal-to-noise ratio to allow for a clean digital derivative to be constructed (as a rule). This means that we can objectively determine a characteristic time scale τ as the inverse of the logarithmic derivative (the e-folding time):
1/τ = dlog(S)/dt
where S is the GOES flux in this case. We show both the flux and the log derivative for our fast event in Figure 1. The full-width-half-maximum time duration of the fast event, with background at 02:41:55 subtracted, is about 35 s. Such events are definitely rare, in the GOES databse, and sometimes reflect the occurrence of something non-solar such as a magnetar. In this case we are not worried about mistaking a cosmic gamma-ray burst for a flare, since we have abundant other solar data that require it to be solar in origin (see below).
The rise and decay times of solar flares have a wide variety of definitions, and the standard GOES ones are particularly subjective or arbitrary. The log derivative is easy to calculate and avoids these issues. Figure 2 shows a whole month of log derivatives, on the order of a million, for the entire month May 25 - June 25, in the form of a histogram.

Are there other interesting aspects of this histogram? It has structure, but as far as we're aware nobody has analyzed these data systematically.
What else do we see?
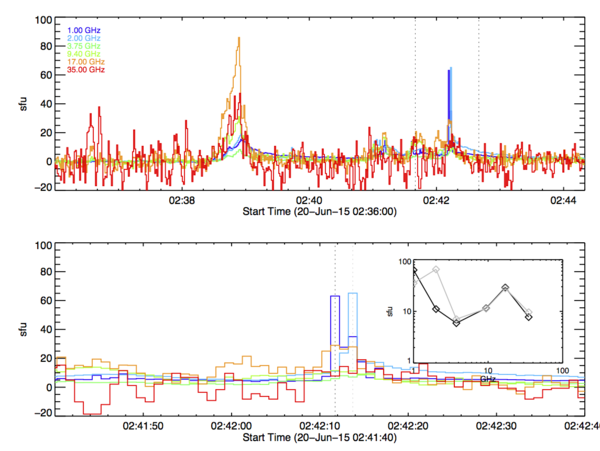
Obviously there are going to be hard X-rays from an impulsive event like this, or at least we would expect that based on experience. Before proceeding with RHESSI, we note the Nobeyama polarimeter data for this event (Figure 3). These show the fast spike not to have a strong gyrosynchrotron component, but there is a peak at 17 GHz; instead we see striking and fast peaks at 1 and 2 GHz. At first glance one might think of type III bursts, but the timing is wrong (1 GHz precedes 2 GHz) and the eCallisto network shows no sign of type III activity. These events might be very interesting narrowband maser sources

On top of these detections, we also see a double-footpoint source both with HMI in white light, and with RHESSI in hard X-rays (Figure 4). We have established that the times of all these sources coincide but still have work to do on detailed overlays. At GOES level 2.3, it is not too surprising for RHESSI to make a >25 keV detection, but quite unusual for any telescope to detect white-light continuum (but see Ref. [1]) - our flare is roughly at the magnitude of the weakest flares showing this phenomenon.

Does the GOES response in this "fastest" event actual reveal non-thermal hard X-ray contributions? No; a simple isothermal fit at 16 MK nicely explains the two passbands, and they have the expected temporal relationship for cooling (very fast cooling, though, with an efolding time of only tens of seconds for the GOES temperature).
Conclusions
This "fastest" GOES event behaves for all the world like a major flare, with hard X-rays, white light, and gyroresonance microwave emission. It has interesting features that warrant further study. In this era of abundant data, an unusual event of this type ("striking similarities, and yet intriguing discrepancies") may enable us to learn interesting new things even from a single solar flare. There's definitely a problem to tackle here: how can the plasma cool so fast in this case? Presumably this means very strong conductive losses, but we need to confirm the feasibility of such an explanation.
References
[1] "Do All Flares Have White-Light Emission?"
| RHESSI Nugget Date | 29 June 2015 + |
| RHESSI Nugget First Author | Hugh Hudson + |
| RHESSI Nugget Index | 256 + |
| RHESSI Nugget Second Author | Paulo Simões + |
