File:116 fig3.jpg
From RHESSI Wiki
Size of this preview: 800 × 571 pixels
Full resolution (1,008 × 720 pixels, file size: 82 KB, MIME type: image/jpeg)
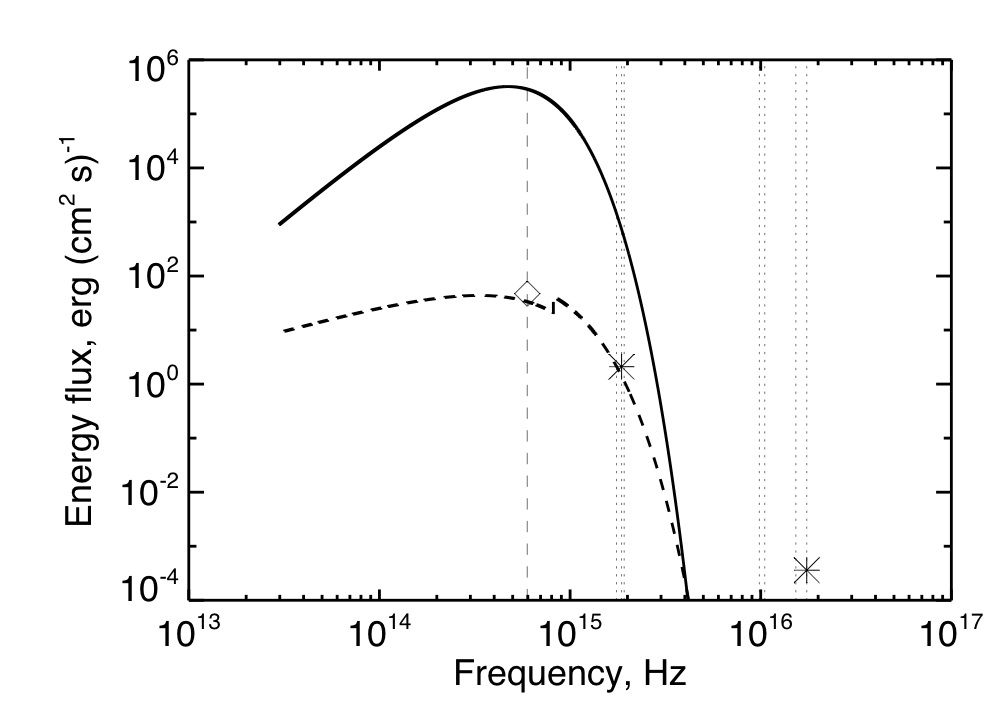
The energy distribution derived from the TRACE images for the impulsive phase of the flare. This is very crude. It represents the photosphere as a blackbody (the solid line), and the flare as a slightly hotter but optically-thin source. This works for 1600A (the left asterisk) but not the EUV point at 171A (the right asterisk). Most of the flare energy is in the low-temperature continuum.
File history
Click on a date/time to view the file as it appeared at that time.
| Date/Time | Thumbnail | Dimensions | User | Comment | |
|---|---|---|---|---|---|
| current | 02:48, 7 December 2009 | | 1,008×720 (82 KB) | Hhudson (Talk | contribs) | (The energy distribution derived from the TRACE images for the impulsive phase of the flare. This is very crude. It represents the photosphere as a blackbody (the solid line), and the flare as a slightly hotter but optically-thin source. This works for 160) |
- Edit this file using an external application (See the setup instructions for more information)
File links
The following page links to this file: