The Curious First Sunquake of Solar Cycle 25
From RHESSI Wiki
| Nugget | |
|---|---|
| Number: | 444 |
| 1st Author: | Alexander KOSOVICHEV |
| 2nd Author: | |
| Published: | February 13, 2023 |
| Next Nugget: | Jets and particles |
| Previous Nugget: | Hard X-ray Pulsations via Gaussian Decomposition |
| List all | |
Introduction
A Sunquake represents the helioseismic response to a solar flare. Acoustic waves excited by strong photospheric impacts travel through the solar interior and are observed on the surface as expanding circular-shaped ripples. The velocity amplitude reaches several hundred meters per second, and the wavefront speed increases with the distance, typically from 10 km/s to 100 km/s. It has been established that sunquakes are usually observed in compact impulsive flares (or compact impulsive parts of complex flares) (e.g., Ref. [1]). The sunquake sources are associated with hard X-ray impulses and observed by the SDO/HMI instrument as transient photospheric perturbations of Doppler velocity, magnetic field, and continuum intensity, occupying areas of just a few arcsec across and not well resolved by the image data.
Evidently, the sunquake sources are caused by high-energy particles accelerated in the impulsive phase of solar flares. However, the standard thick-target hydrodynamic flare model cannot explain such strong perturbations in the deep photospheric layers and thus is not consistent with the HMI observations. Therefore, sunquakes represent a major unsolved problem for the physics of solar flares, interestingly involving both the corona and the deep interior.
== The first sunquake of Cycle 25
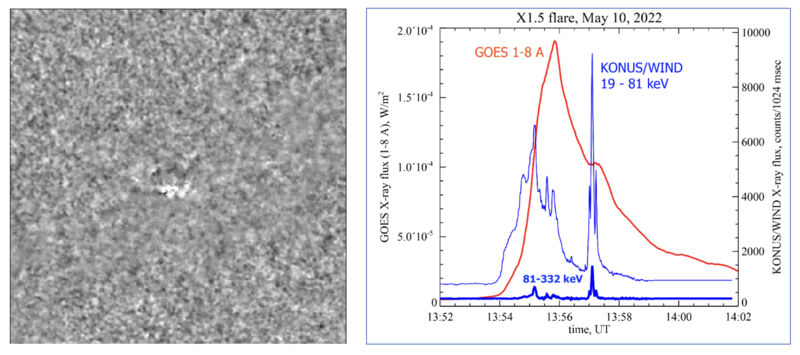
The first significant sunquake of Solar Cycle 25 came with the GOES X1.5 flare SOL2022-05-10. This event revealed some interesting features which shed new light oon the origin of sunquakes. We show an animation of the quake event in Figure 1. constructed from a series of Dopplergrams filtered in a narrow frequency band around five mHz to isolate the acoustic waves from the low-frequency granulation noise. This shows initial impulsive perturbations and two sets of expanding ripples that indicate the presence of two sunquake sources.

Because the flare was located near the central meridian, the photospheric perturbations associated with the hard X-ray impulses are well-resolved in the HMI images taken around 13:56 UT and 13:58 UT (each HMI observing sequence takes 45 sec). Figure 2 shows key images from these times with Doppler contours corresponding to the flare's impact on the body of the Sun (the photosphere).

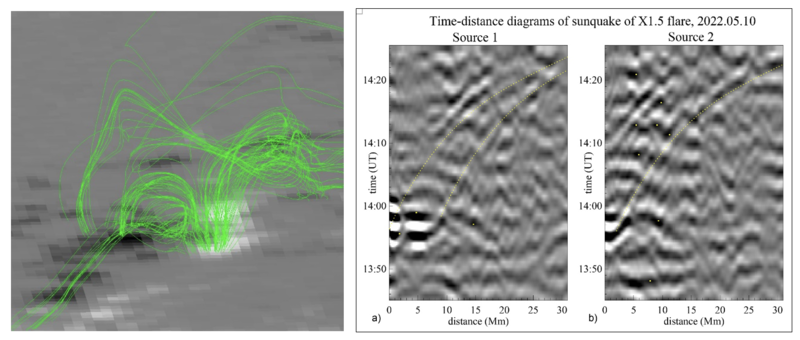
These images show that each of the sunquake sources had a double impact structure, most likely corresponding to the footpoints of magnetic flux tubes across the polarity inversion line. The distance between the impacts of Source 1 is about two arcsecs, indicating the energy release in a low-lying magnetic flux tube. The distance between the impacts of Source 2 is about four arcsecs; however, it appeared stretched along the polarity inversion line. Figure 3 (left panel) shows how these impact regions may be connected magnetically, using an extrapolation of the photospheric magnetic field into the corona with an NLFFF (Non-Linear Force-Free Field) method (Ref. [3]).

Because HMI needs 45 sec to accumulate one measurement, the magnetic and velocity measurements may significantly deviate from the actual properties of the impacts. Nevertheless, these perturbations are substantially stronger than the flare RADYN model predicts. In fact, such strong photospheric perturbations are a general characteristic of all sunquake events.
Conclusions
We have described sunquake sources associated with impulsive acceleration of high-energy particles in compact low-lying loops formed across the polarity inversion line. It is a challenge of flare physics to explain the acceleration of these high-energy particles in the first place, and it is another important challenge to explain the mechanism of their and their (sub)photospheric impact.
References
[1] "Sunquakes of Solar Cycle 24"
[3] "Data-Constrained Solar Modeling with GX Simulator"
| RHESSI Nugget Date | 13 February 2023 + |
| RHESSI Nugget First Author | Alexander KOSOVICHEV + |
| RHESSI Nugget Index | 444 + |