Brilliant Timing
From RHESSI Wiki
| Nugget | |
|---|---|
| Number: | 142 |
| 1st Author: | Säm Krucker |
| 2nd Author: | Hugh Hudson |
| Published: | 20 December 2010 |
| Next Nugget: | The Flares of the RHESSI Monograph |
| Previous Nugget: | M is for Magnifique |
| List all | |
Contents |
Introduction
The very first solar flare ever observed was a so-called "white light flare," meaning that it could be seen visibly even without the aid of spectroscopy. This meant that the photosphere itself increased in brightness, by definition. This meant a large amount of energy; where did this energy come from, and how did it get there? The Carrington flare doubled the intensity of the visible continuum within the white-light flare area, and we know now of other similarly extreme events (such as the one described here). Questions raised by the Carrington flare remain open and are even more interesting now that we understand the structure of the solar atmosphere so much better. Also, of course, our observational tools are a lot better than Carrington's.
An unexpected flare
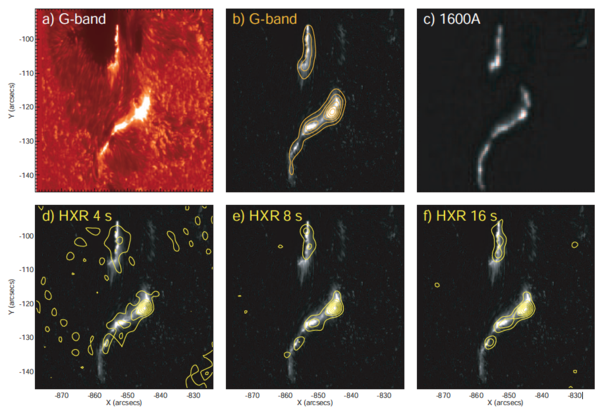
A solid step forward became possible when a strong active region unexpectedly appeared just after the launch of the Hinode satellite. Hinode's main instrument is an optical telescope with unprecedent aperture and hence angular resolution - just what is needed for progress on the problems of a white-light flare. Unfortunately for flare research, Hinode was launched during solar minimum, a time of low activity in general and especially in this case. Luckily within a few weeks an unexpectedly strong flare occurred, one of four X-class flares from the last great active region of the preceding sunspot maximum. Then on the next day our flare happened, with the observations we report here. These featured an exact coincidence between the white-light flare observed by Hinode and the hard X-ray burst observed by RHESSI. This gives us an unprecedented opportunity to study the relationship between these two fundamental properties of a solar flare -- brilliant timing, as shown in Figure 1. One of the few white-light images captured by Hinode at a two-minute cadence was exactly at the time of hard X-ray maximum, a lucky and wholly unexpected circumstance.

This flare also launched a so-called solar tsunami, a powerful wave travelling across the solar disk as massive coronal disturbances developed. As another curiosity, the first flare in the sequence of major events from this active region - about a day earlier - was the first known to have emitted detectable fluxes of high-energy neutral atoms (ref. 2, perhaps the subject of a future Nugget).
Hard X-ray imaging at high resolution
RHESSI rarely gets to display its highest angular resolution because of the limitations of photon counting statistics. Thus a longer exposure is necessary than for an ordinary broad-band optical image. See an earlier Nugget for another discussion of high-resolution hard X-ray imaging. In this event we have been able to compare our best hard X-ray images with the still-sharper Hinode images.

In general there is a remarkable match between these two very different kinds of radiation. This identification is an old story in flare physics, but these brilliant new observations make it much sharper than ever before. In particular the intensity of the energy release we infer from these well-correlated emissions has gotten much larger as the resolution has gotten better. This inference is based on the standard thick-target model. The intensity is the areal density of the energy flux, and for this event the inference - still a lower limit - is at about 40 times the solar luminosity. Note that this is larger than the contrast inferred for the white-light flare itself (an approximately sixfold increase, at ~0.2 arc sec resolution). By what means can this intense flow of energy be maintained? A credible physical theory for this presently does not exist (see Nugget 44 on the "thick target model", for example).
Conclusions
We have described the hard X-ray and white light (actually the photospheric G-band) observations of a particular instant in a powerful solar flare. The excellent agreement between these two very different wave bands implies closely linked emission mechanisms. To the extent that this is borne out, our present model for the impulsive phase of a flare - its most powerful energy release - is seriously challenged by these observations.
References
[2] STEREO Observations of Energetic Neutral Hydrogen Atoms During the 2006 December 5 Solar Flare
| RHESSI Nugget Date | 20 December 2010 + |
| RHESSI Nugget First Author | Säm Krucker + |
| RHESSI Nugget Index | 142 + |
| RHESSI Nugget Second Author | Hugh Hudson + |