High Temperatures in Active Regions
From RHESSI Wiki
| Nugget | |
|---|---|
| Number: | 97 |
| 1st Author: | Jim McTiernan |
| 2nd Author: | |
| Published: | 16 March 2009 |
| Next Nugget: | Chree Analysis for Flares |
| Previous Nugget: | The Jakimiec Track |
| List all | |
Contents |
Introduction
Since RHESSI was launched in February 2002, it has observed thousands of solar flares (more than 46,000(!) in the latest reprocessing of the RHESSI flare list). It was immediately noticed in 2002 that RHESSI was observing solar emission even when there are no flares present (Ref. 1). The minimum temperature required for detectability would be about 5 MK, a temperature range that is not often considered for solar active regions. Most of the instruments previously used for temperature measurements of solar active regions, such as Yohkoh SXT, SOHO EIT or CDS, didn't have much response to higher temperatures. This Nugget describes measurements of the temperature for approximately 7000 time intervals from Feb 2002 through August 2006 (Ref. 2).
Background Subtraction and Interval Selection
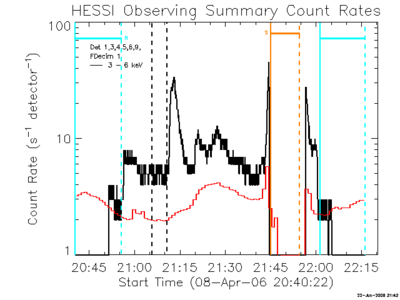
Figure 1 shows the RHESSI count rate for a typical orbit for 8 April 2006. (Nothing special about April 2006, it was just a convenient option when the original SPD poster with this calculation was created.) The plot shows a jump at each day-night transition (terminator). This immediately tells us that the Sun is emitting detectable X-rays. Two things then need to be accomplished before we can get a temperature measurement of a steady-state component that could be related to active regions:
1) Avoid microflares, the SAA, particle events, etc: For each orbit, an interval of between 1 and 5 minutes was chosen based on the following criteria: no flares or particle events, no attenuators, no data gaps, and at least 5 minutes from the SAA. The intervals chosen have the minimum (daylight) count rate for the orbit, subject to a flatness test that insures that there are no microflares in the intervals; the interval in Figure 1 is followed by a microflare.
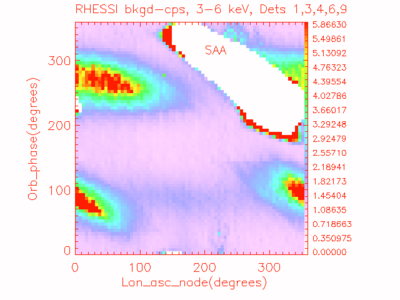
2) Find the background level: You cannot assume that the background can be given by the nighttime values before and after spacecraft day. The background depends on the cosmic ray flux and local particle flux, and it varies with the position of the spacecraft. Figure 2 shows background data, which is calculated from the 5 minute periods before and after daylight for each orbit in the mission.

For the low-latitude regions where most of the temperature measurements were taken, the uncertainty in the background is approximately 1/2 the background rate. For the 3 to 6 keV energy band shown in Figures 1 and 2, this is approximately 1 count per second per detector. The uncertainty is higher for higher latitude regions; e.g., regions which are red in Figure 2.
Measurements
Given a way to choose time intervals and calculate background, we calculate the temperature and emission measure. A total of 8747 time intervals were analyzed, from 14 February 2002 to 2 August 2006. Of these intervals, 6961 had enough counts above the background for a spectrum to be fitted. (The spectra for the fits were accumulated in 1/3 keV energy channels in the energy range from 3 to 30 keV. To be included in the fit, the background-subtracted count rate for a channel was required to be greater than 3 times its uncertainty. Detectors 1,3,4,6,9 were used.) We also obtained temperature and emission measure (EM) from the standard soft X-ray photometry from GOES for each of the intervals. GOES 10 data were used prior to 16 March 2003, and GOES 12 data were used after.
The RHESSI temperature is between 6 and 11 MK, and the GOES temperature is usually between 3 and 6 MK. The GOES EM is typically a factor of 50 to 100 times the RHESSI EM. This is consistent with a differential emission measure that decreases with increasing temperature.
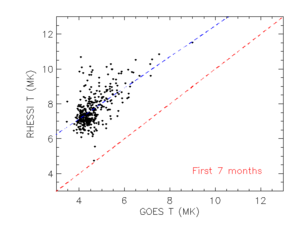
There is a small problem here, though. From Figure 3, it looks as if the two measurements have some correlation. This is not wildly unexpected; GOES should always measure a temperature lower than RHESSI, since it observes lower energy photons, so there should be some correlation due to that. We don't expect the correlation to be perfect; this would require the distribution of emission measure (DEM) to be a constant for all intervals.
In Figure 4, which shows all of the measurements, the rough correlation is gone, and often the GOES T is higher than the RHESSI T. Probably this is due to particles affecting the GOES measurements; we don't have a background subtraction method available for GOES to deal with this sort of problem. This erodes confidence in the GOES measurements -- below an EM (for GOES) of 3x1048 cm − 3, the GOES temperature is often higher than RHESSI's, and the results are suspect. (This is the C level in the GOES long wavelength channel -- which is typically only seen when the Sun is at its most active.)

Here in Figure 5 is the overall time variation of the RHESSI and GOES temperatures and EMs. The average RHESSI temperature is relatively constant for the mission, with a drop from the 7 to 8 MK range to the 6.5 to 7.5 MK range. The RHESSI EM bounces up and down, but the bounces are superposed on a steady decrease of about one order of magnitude. Some of the bounces are pretty well correlated with the monthly sunspot number, particularly in 2002; the correlation coefficient between RHESSI EM and sunspot number is 0.61. The GOES values start relatively constant, and then become erratic at the start of 2003. (The average GOES temperature does remain lower than the average RHESSI temperature, even though the presence of GOES temperatures higher than RHESSI temperatures for individual intervals makes us distrust the GOES values.) The GOES EM decreases steadily by about 2 orders of magnitude.
Heating?
The proven coronal heating process is the heating by flares that results in hot post-flare loops. Is it possible that all we are seeing is post-flare loops, with no need for nanoflare or wave heating or anything fancy? Maybe. The radiative cooling time for a loop of 8 MK and density of 109cm − 3 is about 200 minutes. The conductive cooling time (for a loop length of 105 km) is about 13 minutes. Using the approximation of total cooling time of  (Ref. 3), we find a cooling time of approximately an hour. If there are flares/microflares occurring more frequently than this, then it's conceivable that all of this is residual heating from those events. We know that there are anywhere from 5 to 90 microflares per day (Ref. 4) so there should be events often enough. Whether a single small microflare can result in enough heat to result in a persistent EM as large as observed is an issue that needs to be addressed by solar heating experts in the future.
References
1. Microflares and hot component in solar active regions by A. Benz and P. Grigis
2. RHESSI/GOES Observations of the Non-flaring Sun from 2002 to 2006 by J. McTiernan
3. Cooling of solar flares plasmas. 1: Theoretical considerations by P. Cargill et al.
4. RHESSI Microflare Statistics. I. Flare-Finding and Frequency Distributions by S. Christe et al.
| RHESSI Nugget Date | 16 March 2009 + |
| RHESSI Nugget First Author | Jim McTiernan + |
| RHESSI Nugget Index | 97 + |


