Photospheric response to a flare
From RHESSI Wiki
| Nugget | |
|---|---|
| Number: | 332 |
| 1st Author: | Mike Wheatland |
| 2nd Author: | |
| Published: | 17 September 2018 |
| Next Nugget: | Coronal Hard X-ray Sources Revisited |
| Previous Nugget: | New Views of Global Solar Magnetic Field Evolution Over Four Solar Cycles |
| List all | |
Contents |
Introduction
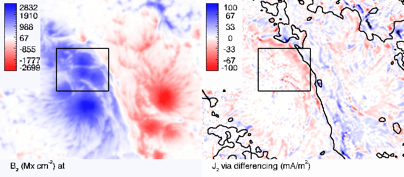
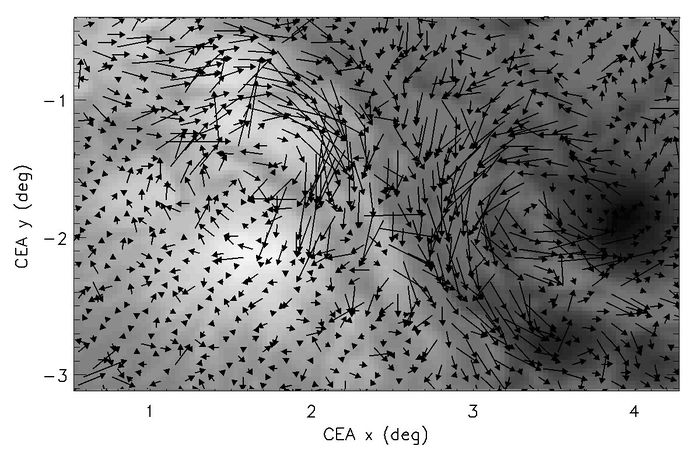
Solar flares involve sudden conversion of magnetic energy into other forms in the solar corona. In particular, flares accelerate large numbers of electrons to 10-100 keV, producing hard-X-ray emission in the low solar atmosphere. Flares introduce sudden and permanent changes in the photospheric magnetic field. Vector magnetogram observations show that the predominant change is in the horizontal magnetic field (parallel to the photosphere), which tends to increase along a flaring neutral line. By definition the neutral line marks the change of polarity of the field, dividing outward from inward domains. Flares can also produce sudden photospheric motion, strikingly illustrated by the rotation of a sunspot in response to a flare (Refs. [1,2]) an event which was likened to "the tail wagging the dog" (Ref. [3]). The sunspot was observed to differentially rotate as the flare ribbons swept across it. Figures 1 and 2 show photospheric data for this event.

The photospheric field changes are interpreted as the photospheric response to coronal magnetic restructuring due to magnetic reconnection. Here we consider a simple 2D model for the changes in the field and flows introduced at the photosphere, in terms of a large-amplitude shear Alfvén wave impacting the photosphere (Ref. [4]).
Large amplitude shear Alfvén wave model
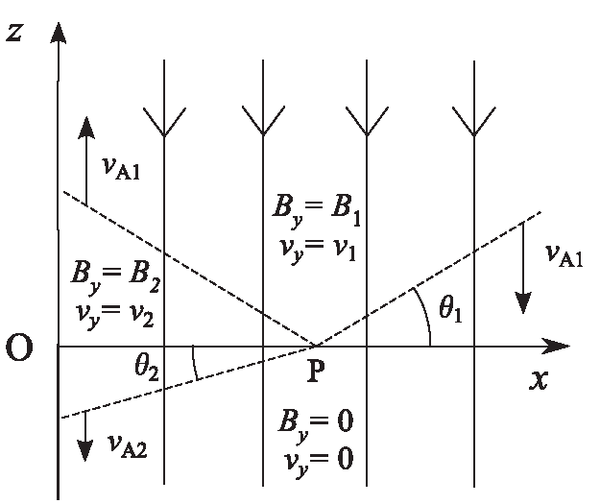
We consider a simple 2D model in which the photosphere is the z = 0 plane, and the x-axis is directed away from the neutral line. Figure 3 illustrates the model. A large-amplitude shear Alfvén wave is assumed to propagate downwards at the coronal Alfvén speed A1, introducing shear field and flow components By = B1 and vy = v1, respectively, behind a front. The wave front is assumed to be obliquely oriented to the photosphere, so that the changes are introduced first close to the neutral line, and then further away. The wave is partially reflected and partially transmitted at the photospheric boundary. The wave propagates at a lower Alfvén speed vA2 in the sub-photosphere. Behind the reflected and transmitted fronts, there are new shear components By = B2 and vy = v2.
The MHD equations and continuity imply the relationships:
so that in the limit of a very dense photosphere, B2 ➝ 2B1 and v2 ➝ 0.

This simple model can account for a variety of features of the observations. If the wave is incident on the photosphere on both sides of the neutral line and the change in the field is in the same direction on either side, then the plasma flow is oppositely directed on either side, reproducing the qualitative features of the observations. The shear field and flow components are related by the Walén relation v2 = -vA2B2/B0. This implies changes quantitatively consistent with observed values.
Particle acceleration
Flare ribbons are the locations of hard X-ray emission in flares. In the model, the flare ribbons are assumed to coincide with the front, and the front represents a surface current. The geometry implies a field-aligned electric field if the conductivity of the plasma is finite. Above a critical value, this field may produce electron runaway. Assuming that the dominant resistivity is due to electron-neutral collisions, we estimate that the thickness of the front must be of order 10 m to produce runaway. Although this model for particle acceleration is speculative, it has an attractive feature. Standard models for particle acceleration assume that acceleration occurs in the corona, but this raises a "number problem": the electron flux implied by the photospheric observations implies acceleration of a very large volume of electrons in the rarified corona. Acceleration in the dense lower atmosphere avoids this difficulty. However, the present model also implies an asymmetry in the direction of electron acceleration on either side of the neutral line: more hard X-rays are expected on one side of the line than the other. Figure 4 illustrates this point.

Conclusions
Flares are observed to produce sudden changes in the photospheric field, and to introduce shear flows, along the flaring neutral line. We present a simple model for the changes in terms of a large-amplitude shear Alfvén wave impacting the photosphere. This model can account for various features of the observations. It also introduces a possible mechanism for electron acceleration in the low atmosphere, which might avoid the electron "number problem."
References
[1] "Flare differentially rotates sunspot on Sun's surface"
[2] "Evolution of Photospheric Flow and Magnetic Fields Associated with the 2015 June 22 M6.5 Flare"
[3] "Solar physics: When the tail wags the dog"
[4] "Photospheric Response to a Flare"
| RHESSI Nugget Date | 17 September 2018 + |
| RHESSI Nugget First Author | Mike Wheatland + |
| RHESSI Nugget Index | 332 + |

